Stocks in Play
“You are only as good as the stocks that you trade” is an often-repeated saying in the trading community. You can be the best trader in the world, but if your stocks do not move or have enough volume, then you cannot make money consistently. Trading a stock that doesn’t move is a trading day wasted. You don’t just look though for stocks that simply move. You also want to be able to determine that they will move in a certain direction. It is possible that a stock that moves $5 intraday may never offer you excellent risk/reward opportunities. Some stocks move too much intraday without foreshadowing their direction.
I often get emails from traders saying that they struggle with finding the right stocks to trade. Many of them understand how trading works and have a proper education and the right gear for day trading, but when it comes to actually finding stocks to trade in real time, they are clueless. I certainly experienced this as a new trader. If you learn the strategies explained in Chapter 6, but you cannot make money consistently, it is possible that you are in the wrong stock. Again, you are only as good as the stocks that you trade. You need to find the stocks that are in play by day traders or, as I call them, Stocks in Play.
There is more than one way to select Stocks in Play and make money trading them, and there is definitely more than one correct way. This chapter details how I and many of the traders in our community find Stocks in Play. Of course, this is not the only correct way. Some traders trade baskets of stocks and indices. While I avoid trading exchange-traded funds (ETFs), some day traders, like my friend Trader Brian, very regularly trade them. Many have developed proprietary filters to find stocks. Others concentrate on trading the markets as a whole with index futures. Often professional traders at the trading desks of the big banks simply trade in a sector like gold or oil or tech. But remember, we are retail traders with limited amounts of capital, so we must be efficient with selecting our Stocks in Play. As a day trader, you must be efficient with your time and buying power.
A Stock in Play is a stock that offers excellent risk/reward setup opportunities - opportunities where your downside is 5 cents and your upside is 25 cents, or your downside is 20 cents and your upside is one dollar. That’s 1:5. You can regularly read a Stock in Play that is about to trade higher or lower from its present price. Stocks in Play move, and their moves are predictable and frequent and catchable. A good intraday stock offers numerous and excellent risk/reward opportunities.
Every day, there are new stocks that are in play. Trading Stocks in Play allow you to be the most efficient with your buying power. They often offer much better risk/reward opportunities intraday and allow you to execute your ideas and trading rules with more consistency. Trading the right Stocks in Play can help you to combat algorithmic programs.
What are Stocks in Play? They could be, in no particular order:
- A stock with fresh news
- A stock that is up or down more than 2% before the market Open
- A stock that has an unusual pre-market trading activity
- A stock that develops important intraday levels from which you can trade off
You need to keep in mind that retail trading does not work on all stocks. It only works on the stocks that have high relative volume. Some stocks like Apple Inc. (ticker: AAPL) will on average trade millions and millions of shares each day, while other stocks on average might trade only 500,000 shares each day. Does this mean you should trade AAPL only? No. High volume will be relative from one stock to another. You don’t look just for high total volume. There are some stocks that regularly trade with high volume. What you need to look for is what is above average for that specific stock. Thirty million shares of AAPL traded in one day might very well not be higher than usual, and you should not trade AAPL unless it has a very unusual trading volume. If trading volume is not higher than normal, it means that the trading is being dominated by institutional traders and high frequency trading computers. Stay away from it.

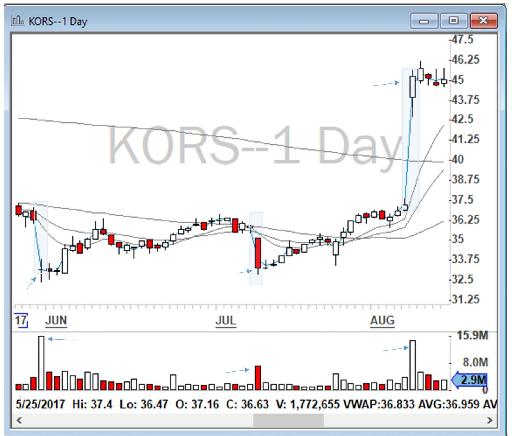
Figure 3.1 - KORS daily chart for the summer of 2017. The days that KORS had a significant relative volume are marked. Those days were suitable for day trading KORS.
Figure 3.1 is the daily chart for the summer of 2017 for Michael Kors Holdings Ltd. (ticker: KORS). It shows that there were only three days that had high relative activity. They’re marked with arrows on the chart. Interestingly enough, when you take a close look at the chart, you realize that on those days the stock gapped up or down. I marked those price gaps on the chart. If you wanted to trade KORS, you should have traded it only on those days. The other days were comprised of just normal, high frequency, algorithmic trading and, of course, retail traders should stay away from stocks that are trading normally.
The most important characteristic of high relative volume stocks is that these stocks trade independent of what their sector and the overall market are doing. When the market is weak, it means that the majority of stocks are selling off. It does not matter if it is Apple, Facebook, Amazon, or Exxon Mobil. When the market is strong, the prices of the majority of stocks will be going higher. Similarly, when you hear someone say the market is “bear” or “collapsing”, they aren’t referring to a specific stock. They mean that the whole stock market is losing its value - all stocks together. The same is true for specific sectors. For example, when the pharmaceutical sector is weak, it means all of the pharmaceutical companies are losing their values together.
How do you recognize the behavior of the market? Index funds that were explained in Chapter 2, such as the Dow Jones Industrial Average (DJIA or INDU$) or the S&P 500 (SPY), are usually good indicators of what the overall market is doing. If the Dow Jones or the SPY are red, it means that the overall market is weak. If the Dow Jones or the SPY are strong, then the overall market will be going higher.
The behavior of stocks that have high relative volume independent of the overall market are referred to as Stocks in Play. Every day, only a handful of stocks are being traded independently of their sector and the overall market. Day traders trade only those stocks. I sometimes call those stocks “Alpha”, because in the animal kingdom, alpha is a predator at the top of a food chain upon which no other creatures prey. In day trading, alpha stocks are the ones that are independent of both the overall market and their sector. The market and high frequency trading cannot control them. We call these Stocks in Play.
It is wise to remember this rule:
Retail traders trade only Stocks in Play - high relative volume stocks that have fundamental catalysts and are being traded regardless of the overall market.

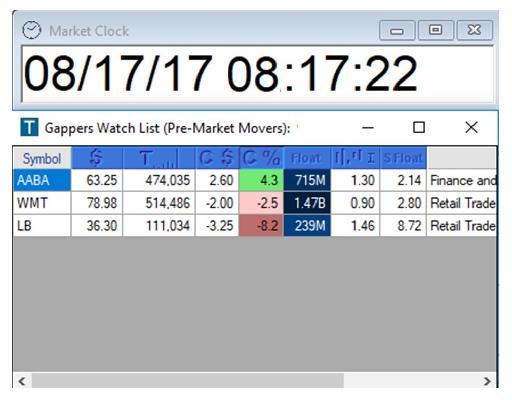
Figure 3.2 - My scanner’s Gappers watchlist showing that LB was gapping down significantly in the pre-market on August 17, 2017.
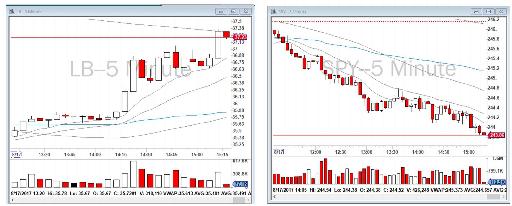
To illustrate this, let’s review the price action of LB on August 17, 2017. Figure 3.2 shows that LB was gapping down significantly in the pre-market by 8.2%. If you look at Figure 3.3, comparing the trading day behavior of SPY (as an overall market indicator) with LB, you will see that they are completely the opposite of each other.

Figure 3.3 - Comparison of the trading day behavior of LB and SPY. You will note that the overall market is selling off (SPY is considered an overall market indicator), but at the same time LB is moving upward.
What makes a stock a Stock in Play? Usually it is the release of fundamental news about the stock either the day before or during the same trading day. Important news or events for companies can have significant impacts on their value in the market and therefore act as fundamental catalysts for their price action.
Here are some examples of the fundamental catalysts for stocks that make them suitable for day trading:
- Earnings reports
- Earnings warnings or pre-announcements
- Earnings surprises
- FDA approvals or disapprovals
- Mergers/acquisitions
- Alliances, partnerships or major product releases
- Major contract wins/losses
- Restructurings, layoffs or management changes
- Stock splits, buybacks or debt offerings
I check the news on all stocks up or down more than 2% pre-market and shortlist my Gappers watchlist (which I will explain further along in this book). Stocks in Play the day before are often still in play for a few days after.
In Chapter 6, I explain specific day trading strategies such as Bull Flag, Fallen Angel and VWAP. For the moment, your main question needs to be, how do I find the stock for each strategy? I categorize stocks for retail trading into three classes. Based on my experiences, this categorization provides some clarity on how to find stocks and on how to adopt a strategy for them.
Table of contents
- DISCLAIMER:
- Table of Contents
- Chapter 1: Introduction
- Chapter 2: The Trading Tools and Platform
- Chapter 3: Building Your Trading Watchlist
- Chapter 4: Support and Resistance Levels
- Chapter 5: Price Action, Candlesticks and Trade Management
- Chapter 6: Advanced Day Trading Strategies
- Chapter 7: Risk and Account Management
- Chapter 8: Conclusion and Final Words
- Glossary