Understanding Nasdaq Level 2 Signals
As I discussed in Chapter 2, the most important window in your trading platform is often the Montage window or Level 2. This next section is about understanding Level 2 and its signals for trading. Level 2 is often called market depth and sometimes you will find very useful information in there. Most of the time you really can't find any clear signals and answers there, but once in a while there are some clear signals for trading that you can use in addition to the other indicators and signals you have. One clear signal is when you notice a large order on the bid or on the ask. If you notice a large order on the bid it means that there's a big buyer sitting down. And the big buyer is a very bearish sign, signaling a drop in the price. Yes, you read this previous sentence correctly, a big buyer may signal a drop in the price.
On the other hand, a big ask may indicate there's a big seller sitting up there and that in fact may be a very bullish sign. Yes, again, you read this correctly, a big seller may signal an increase in price. Therefore, if you see a big ask, the price may increase.
I understand this is very counterintuitive for most people. People believe that, just like in any typical supply and demand system, a big buyer should push the price higher. And similarly, they believe a big seller will push the price lower as that seller might dump their shares at any moment. But that's not the case in day trading. It's usually the other way around.
I will explain this concept further with a few examples. As shown in Figure 5.15, on August 3, 2017, TEVA was selling off. The stock price was down 20%, and I noticed that at 11:21 a.m. there were many people buying at $25. At 11:26 a.m., five minutes later, the price hit $25, and after twenty additional minutes, it went to $24.52, and all of those people who were waiting were now gone. You can see that over time the price kept going lower and lower.
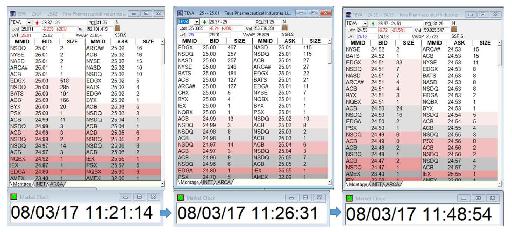
Figure 5.15 - Level 2 for TEVA.
But why? What was going on? If all of those people were big buyers, why wouldn’t the price have gone higher?
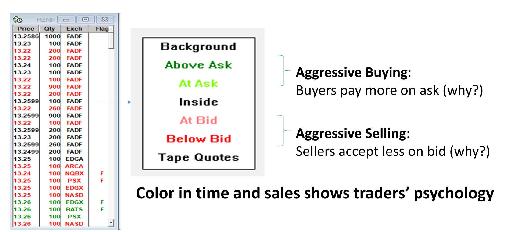
Figure 5.16 – Screenshot of the Time and Sale window in the DAS trading platform. (If you are reading the print version of this book, this figure will appear in black and white. To access a color copy of it, please visit our website at www.BearBullTraders.com/audiobook.)
In order to answer that, you need to understand the psychology of the traders sending orders to the market. As I have mentioned, day traders are social psychologists sitting behind a trading platform and charting software. In the Time and Sale window of your trading platform, you can see where each transaction happened: was it at the ask or above the ask, or was it happening between the bid and the ask, or was it happening below the bid? The way traders are actually making their trades shows what kind of attitude they have toward the current price and its future direction. A screenshot of the Time and Sale window in my DAS trading platform appears above as Figure 5.16.
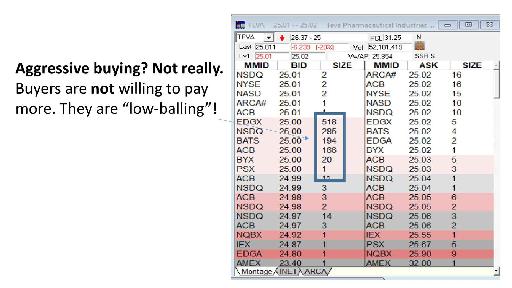
Figure 5.17 - Big buyers on Level 2: aggressive or not?
If people are buying at the ask or above the ask, it means that they are aggressive buyers. They are willing to pay more on the ask side. If I’m a big buyer, and I’m constantly buying on the ask, it means that I'm desperate. I may be short and I have to cover. I'm buying on the ask and I do not want to sit on the bid. It is unlikely that you will see any aggressive buyers on the bid side, waiting to perhaps get filled. The aggressive buyers will hit the ask. The not so aggressive buyers are “low-balling”, they want the price to come to them. They bid lower and lower, as they know that the price will eventually come to them.
Imagine you are a big buyer in a depressed housing market. If you know the market is slow, you will be offering lower and lower prices to the seller of the house of your choice. You try to get a deal, and so you try to bargain for a lower price. But in a hot real estate housing market, houses are receiving multiple offers and buyers are willing to pay even more than the asking price in order to purchase the home of their dreams. That is the equivalent of hitting the ask and above the ask in Level 2. That is when the price moves higher.
But what if traders are constantly hitting the bid, or selling their position to the bid and lower? These are aggressive sellers. There could be any number of reasons they're willing to accept a lesser price on the bid side, but whatever the reason, they want to get rid of their stocks.
As you can see, this is all about the psychology of trading. If you take a look at the above Figure 5.17, do you think the bids that I have highlighted are from big buyers? The answer is yes, these are big buyers, but they are holding and waiting because they are not willing to pay to the ask. If they were really aggressive, they would go and hit the ask all of the time. However, these buyers are not aggressive, they are low-balling, they're just waiting, and forcing the price to come to them.
They’re patient. They're not going to pay on the ask. They're not desperate, they're just waiting until the price comes to them. So yes, they are big buyers, but they can and they will wait until they can get the bargain price that they’re looking for.
Something that is important about Level 2 signals is that if you want to trade on this level, there has to be an obvious imbalance in the orders: one side will have huge orders, and the other side will have nothing. This imbalance must be very obvious. In Figure 5.17 it is obvious that there are considerably more orders on the bid side. This is a good signal. However, if the Level 2 data presents in such a way that you really cannot say which side is stronger, then that is probably not an indication of anything. It's just random, because in order to have a clear signal there has to be a very clear and powerful bid or a very clear and powerful ask.
Fake or Real Signals
Market makers know this, and sometimes they try to mislead traders with orders that they have no intention of filling. These orders are called NITF orders (no intention to fill orders). They do this to give the impression that either an abnormally big buyer or an abnormally big seller is in the market. To distinguish between these real orders and no intention orders, you have to see where they are placed in the market book. Real orders are placed near the current bid and ask, and they are likely to get filled. No intention orders, on the other hand, are usually placed far from the current bid and ask. They can be quickly and easily cancelled.
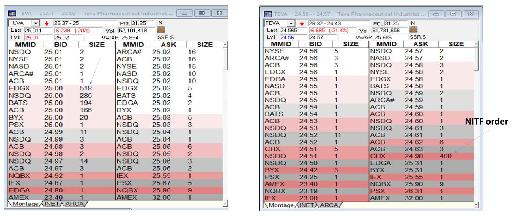
Figure 5.18 - In the left-hand image, real orders on the bid side from various market makers and, in the right-hand image, an example of an NITF (no intention to fill) order on the ask side from market maker CHX. The ask of 40,000 shares by CHX is obviously too far from the current ask, and there is no point for any market maker to show their hand like this.
As you can see on the left-hand side of Figure 5.18, the big bids from market makers EDGX, NSDQ, BATS and ACB are very close to the current bid, only 1 cent away, so they are most likely legitimate. However, on the right-hand side of Figure 5.18, you can see a 40,000 offer all on its own, which means this is probably an NITF (no intention to fill) order because its ask price is quite far away from the current bid or ask. The stock is currently being traded at around $24.56 or $24.57. This particular market maker just put out an ask at $24.98, which is 40+ cents away from the current price. It’s just a random number and the seller did this only to manipulate the market and to manipulate amateur traders who would not know any better. It is not a serious ask because the price would never immediately jump up to $25. If the seller was serious, they would have put their ask in the $24.58 to $24.59 range. In the above example, the only serious bids and asks are going to be between $24.50 and $24.63. These are the ones that could get filled immediately. Any other orders are really not intended to be filled. The signals you are looking for are the ones that are very close to the current bid or ask.
Let’s review another example of a clear trading signal on Level 2, as set out in Figure 5.19. On the left-hand side you will see two big bids at $42 each. This can be a short selling signal. As discussed, these big bids are bearish, meaning that the traders expect the price to drop even more. Less than one minute later it did drop from $42 to $41.84. Traders now take their bids even lower, expecting an even further price drop. Remember, the buyers are low-balling, they are not willing to pay higher, and they expect the price to go lower. The big bids now go lower, to $41.80, and less than 20 seconds later the price drops again to $41.66.
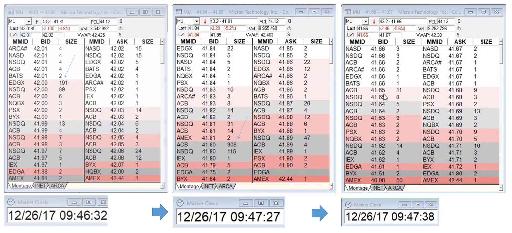
Figure 5.19 - Example of a clear trading signal on Level 2 for Micron Technology, Inc.
Now that you understand these levels, the burning question is, should you take the trade every time you find these clear signals? The answer to that question is no. The introduction of high frequency and algorithmic trading has made trading more challenging for retail traders like us. Many signals appear and disappear quickly in the market depth. Therefore, it is important to not base your trading decision only on one signal or indicator.
In other words, every time that you see a big bid does not mean that you should go short, nor every time that you see a big ask should you go long. Level 2 signals are only one indicator that you should look at. I never trade based only on one signal or indicator. You have to objectively look at the Level 2, and then also look at other indicators, and then put everything in perspective, and only then make your decision.
Where is the price compared to VWAP? What about the daily chart? Is there any important level nearby? What about the volume? There are many other important indicators that you have to look at before entering any trade. You have to make sure that when you're actually making a trade based on a Level 2 signal indicator, that there are also other indicators to confirm the trade you're about to make. For example, if the stock is selling off heavily on a 5-minute chart, but you see a signal on the ask, you should not just go long based on that signal only. You need to consider many other indicators before taking that reversal trade.
You’ll recall in Figure 5.19 above, the Level 2 for MU on December 26, 2017, there were two big bids placed for $42 each. It was a very clear Level 2 trading signal. Now let’s look at the other indicators for MU that day. Figure 5.20 shows that: (1) MU had hit my Turbo Breakdown Scanner with heavy volume, (2) on my 5-minute chart I saw a series of bearish candlesticks and a Lower Lows and Lower Highs Pattern, and (3) on my daily chart I saw that MU was selling off below all of the daily moving averages toward an important level of $41.73 (which I’ve marked on the chart). This combination of signals, in addition to the Level 2 signal discussed above, offered a good trading opportunity.
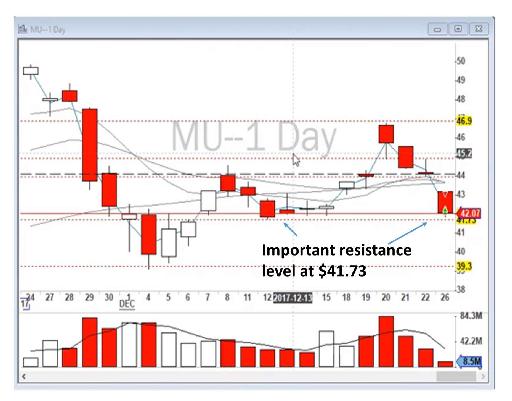
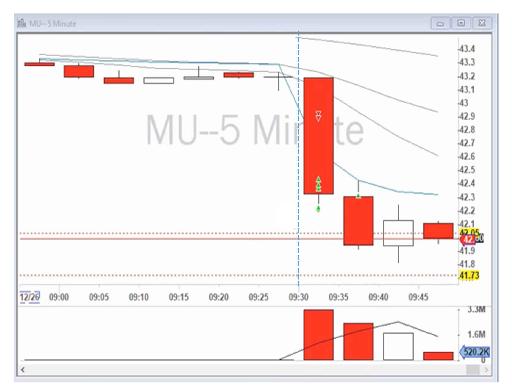
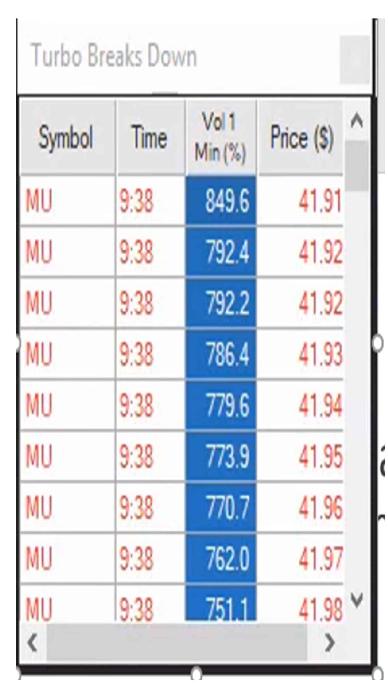
Figure 5.20 - Several signals on MU which taken together indicated a good trading opportunity.
Because this stock was going through a very important support level, there was a really good chance it would sell off to $41.73. And as you see, by the time I took a screenshot of it, it did in fact drop to $41.73. So that's the entire point. Everything else was confirming that the stock was going to sell off. Even if you didn't have that Level 2 signal, you probably would have still taken this trade.
Another excellent illustration of signals in Level 2 is shown in Figure 5.21, the Level 2 of MOMO on March 7, 2018. MOMO was selling off below the VWAP and it was perfect for an Opening Range Breakout with a short position. I was ready to go short, but I saw big sellers on the ask. These sellers were not desperate, and they were “demanding” higher prices, because they knew the price would come to them. As you can see, the stock went from $36.92 at 9:39:13 a.m. to squeeze above $37.42 at 9:39:53 a.m. You will also see in Figure 5.21 that there is a no intention to fill (NITF) order at $38.95 by the market maker AMEX.
This example is interesting because I actually did trade MOMO on the short side. I went short below the VWAP, but when I saw the bullish signal on Level 2, I covered my shorts early, therefore avoiding a bad short squeeze (if you are not familiar with what a short squeeze is, please take a moment to look at the definition in the Glossary at the back of this book). It happened that I actually recorded this trade live and you can check my YouTube channel or my website to watch this trade and price action in real time. Here’s a link: https://youtu.be/wDoW94Qxvy4
The key takeaway in this trade is: I did not go long just because I saw this Level 2 signal, instead, I avoided a loss by managing my trade based on this signal. Why did I not go long after seeing this signal? The reasons are important to understand. The price action, my charts and the other indicators were not supporting a long position. MOMO was selling off heavily below VWAP and I was leaning more toward going short rather than long. The signal was not strong enough for a long trade, but it was enough to indicate that the sellers may soon get exhausted. Please watch the video in real time in the above link and you can follow along with my real time decision-making process as well as listen to some commentary from me.
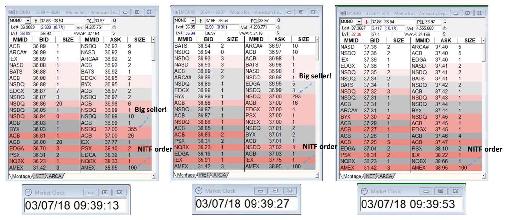
Figure 5.21 – Level 2 signals on MOMO.
Table of contents
- DISCLAIMER:
- Table of Contents
- Chapter 1: Introduction
- Chapter 2: The Trading Tools and Platform
- Chapter 3: Building Your Trading Watchlist
- Chapter 4: Support and Resistance Levels
- Chapter 5: Price Action, Candlesticks and Trade Management
- Chapter 6: Advanced Day Trading Strategies
- Chapter 7: Risk and Account Management
- Chapter 8: Conclusion and Final Words
- Glossary