Strategy 1: Fallen Angel
One of the powerful strategies I use for low float stocks is the so-called “Fallen Angel”. An Angel is a low float stock (usually less than twenty million shares) that has gapped up significantly due to important fundamental news. The stock will be trading heavily in the pre-market, with often over one million shares before the Open. With low float stocks, and for this strategy in particular, the trading volume is the key. If the stock does not have much volume, no matter how much it has gapped up, or what the float really is, you should stay away from it. Low volume low float stocks are subjected to “pump and dump” or manipulation and trading them often results in heavy losses.
The Angel (our low float Stock in Play) usually opens higher and makes a new high of the day quickly, but will then sell off heavily. The first uptick at the Open is often a trap for bullish traders, and is followed by a massive sell off either because of heavy profit taking from overnight traders or short sellers or both. When the Angel sells off, it has every right to go down, however, if it holds a support, it usually comes back up above VWAP and the previous high of the day. That's typically when you want to catch it.
To summarize this pattern: when the market opens, the stock will make a new high of the day but sell off quickly. You do not want to jump into the trade yet, not until it consolidates around a trading level such as the low of the pre-market, or moving averages on a daily or 5-minute chart. As soon as the stock is coming back up with heavy volume, that is the place that you take the trade to the long side. The entry signal is to see a new 1-minute or 5-minute high after the consolidation with MASSIVE volume only. You have to remember that the volume on the way up needs to be significantly higher than previous candlesticks.
To illustrate this strategy, let’s review my Gappers watchlist on December 14, 2017, as shown in Figure 6.1. As you can see, Schmitt Industries, Inc. (ticker: SMIT) has gapped up almost 70% with heavy volume at the pre-market. As can also be seen on the watchlist, by 9 a.m. almost 700,000 shares have been traded. You can also see that SMIT is a low float stock with a float of only 2.7 million shares. For your perusal, I have also included in Figure 6.1 a 5-minute chart for SMIT showing its pre-market activity.
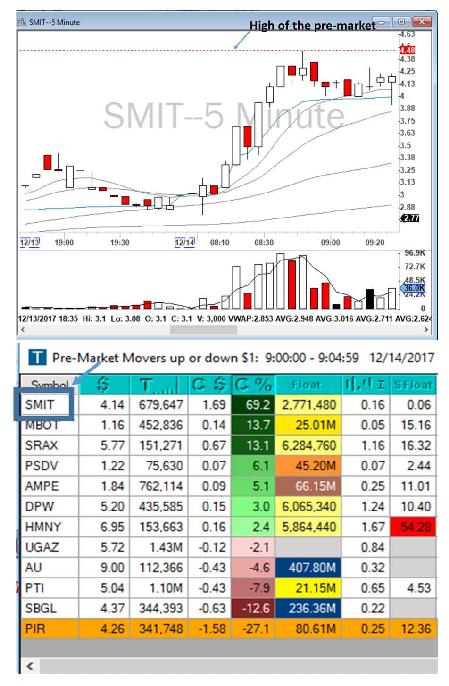
Figure 6.1 - Gappers watchlist on December 14, 2017 (bottom) and 5-minute chart showing pre-market activity of SMIT (top).
As you can see in Figure 6.2, at the Open SMIT went higher and quickly to $4.36 but then as quickly sold off below VWAP to around $3.70 and held that level for about 30 minutes. Right after 10 a.m., SMIT made a new 5-minute and 1-minute high (compared to previous candlesticks) with heavy volume and moved toward VWAP. It pushed toward the then high of the day of $4.36 and eventually toward the high of the pre-market of $4.48. A great entry would have been around 10:05 a.m. at around $3.80 when SMIT made a 1-minute high above 9 and 20 EMA with a stop loss below $3.70 (all shown in Figure 6.2). As discussed, the profit target could have been the VWAP at around $4, the then high of the day of $4.36, and the high of the pre-market of $4.48.
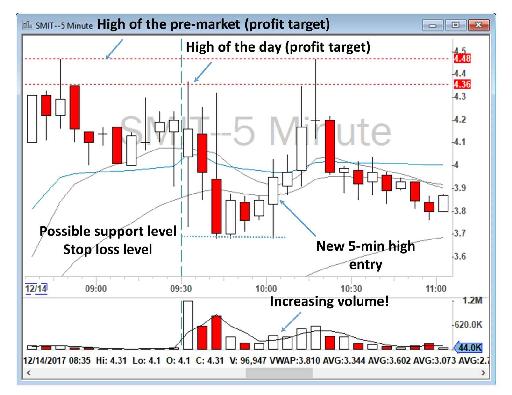
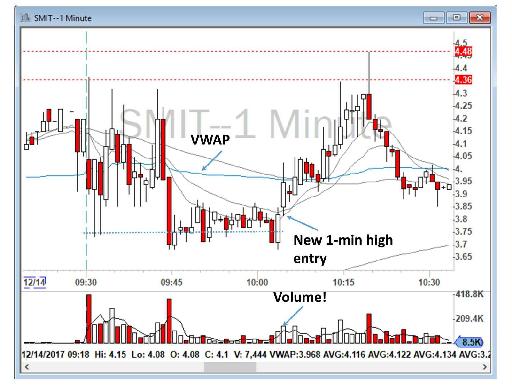
Figure 6.2 - 5-minute and 1-minute charts of SMIT showing potential entry, exit and stop loss levels.
As you know, I practice what I preach! I myself traded SMIT on that day based on this strategy and made $883, as can be seen in Figure 6.3. I also traded some other stocks that are not relevant to this strategy.
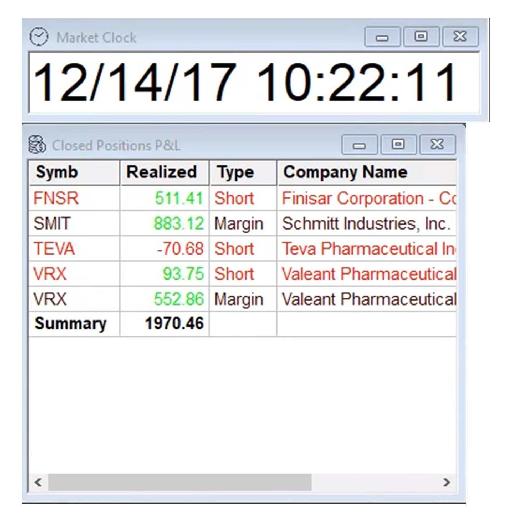
Figure 6.3 - My closed P&L on December 14, 2017.
Another example can be seen in my trading of Genocea Biosciences, Inc. (ticker: GNCA) after its surprisingly good earnings on Friday, July 21, 2017. When the market opened on Monday, July 24, GNCA quickly went up to $5.70, but then sold off as quickly toward $5.30 and consolidated around that level. Interestingly, as can be seen in Figure 6.4, both the 50 SMA on my 5-minute chart and the 200 SMA on my 1-minute chart were also around $5.30. Having two important moving averages on both 5-minute and 1-minute charts make that level even stronger. GNCA consolidated between $5.40 to $5.30 until it made a new 1-minute high at 9:47 a.m. with heavy volume toward the then high of the day of $5.70 and the high of the pre-market of $5.75. After it tested the high of the pre-market at around $5.75, it sold off back toward its low of the day.
A good entry would have been around $5.40 with a stop loss below $5.30 and profit targets of $5.70 and $5.75.
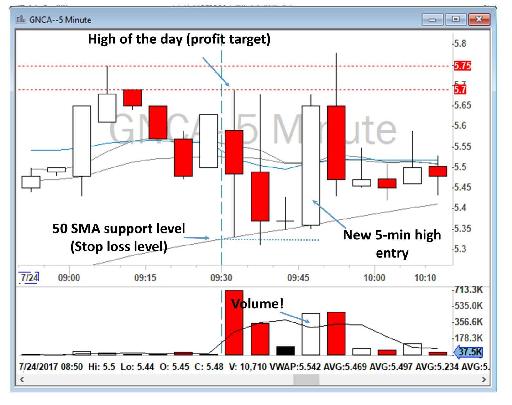
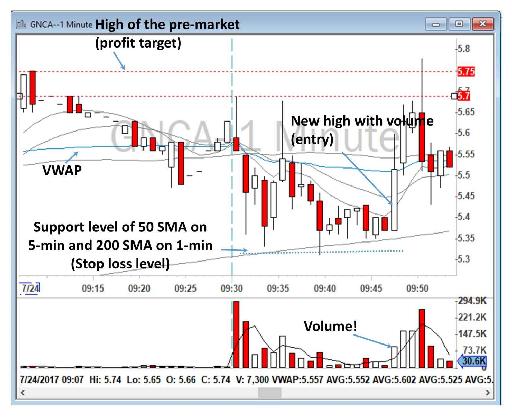
Figure 6.4 - 5-minute and 1-minute charts of GNCA showing potential entry, exit and stop loss levels.
I myself took that trade, but I could not make a good entry. I entered at around $5.55, added more at $5.60, and sold toward $5.75, with only a $325 profit, as shown, along with my entries and exits, in Figure 6.5. These trades happen very quickly and getting an excellent entry and proper exit can be very difficult.
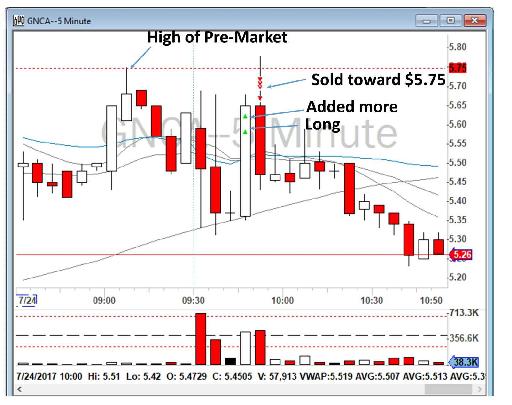
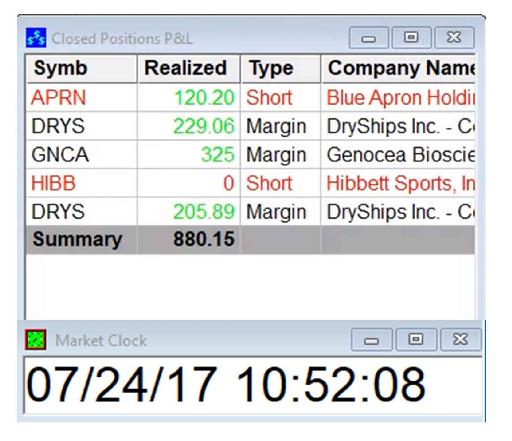
Figure 6.5 - Screenshot of my real time trade on GNCA on a 5-minute chart on July 24, 2017 showing my entries and exits and screenshot of my closed P&L for that day.
Similar trading behavior was seen on GNCA the following day. Figure 6.6, my Top List for July 25, 2017, shows that GNCA was still one of the Nasdaq’s most active and highest gainers. Stocks in Play can remain in play for a few days after a fundamental news break.
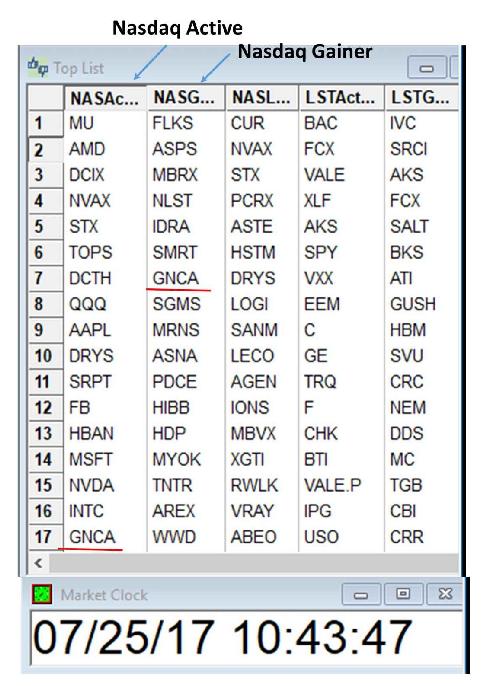
Figure 6.6 – My Top List for July 25, 2017.
As you will see in Figure 6.7, when the market opened at 9:30 a.m. on July 25, 2017, GNCA quickly went up and made a high of the day of $6.55, but then sold quickly toward $6.20 and consolidated at that level. Again, as in the day before, 50 SMA on my 5-minute chart was also moving around this consolidation area, this time at $6.20. GNCA consolidated between $6.20 to $6.30 until it made a new 1-minute high at 9:43 a.m. toward the then high of the day of $6.55 and the high of the pre-market of $6.69. GNCA actually went to above $6.79 before selling off back toward its low of the day.
A good entry would have been around $6.35 with a stop loss below $6.30 and profit targets of $6.55 and $6.69.
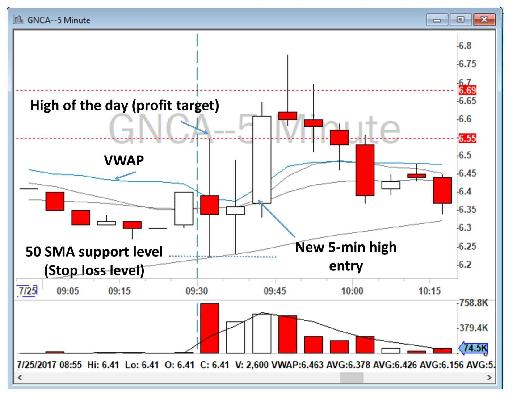
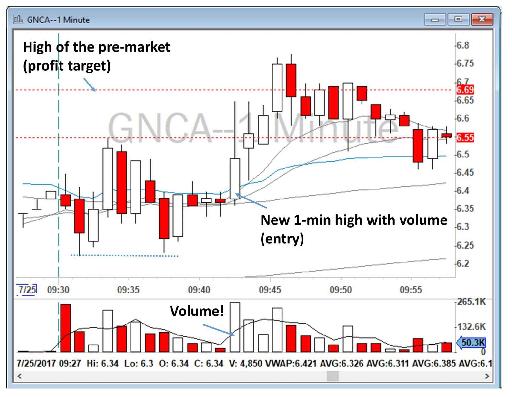
Figure 6.7 - 5-minute and 1-minute charts of GNCA on July 25, 2017 showing potential entry, exit and stop loss levels.
Another example of the Fallen Angel Strategy can be seen when DryShips Inc. (ticker: DRYS) experienced another wild day of trading after its one-for-seven reverse stock split. When the market opened at 9:30 a.m. on July 24, 2017, DRYS quickly went up to $2.75, but then sold off quickly toward $2.35 and consolidated around that level. As can be seen in Figure 6.8, again, both 50 SMA on my 5-minute chart and 200 SMA on my 1-minute chart were also around this $2.35 level. As mentioned previously, having two important moving averages on both 5-minute and 1-minute charts make that level even stronger. DRYS consolidated between $2.45 to $2.30 until it made a new 5-minute high at 9:57 a.m. with heavy volume toward the then high of the day of $2.75 and the high of the pre-market of $2.84. After it tested the high of the pre-market, it moved toward testing yesterday’s high at $2.95, before selling off back below VWAP.
A good entry would have been around $2.45 with a stop loss below $2.30 and profit targets of $2.75, $2.84, and $2.95.
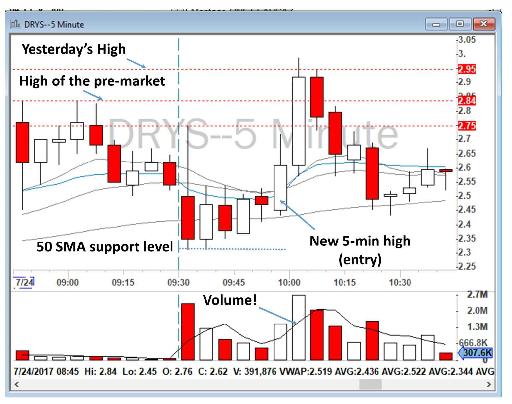
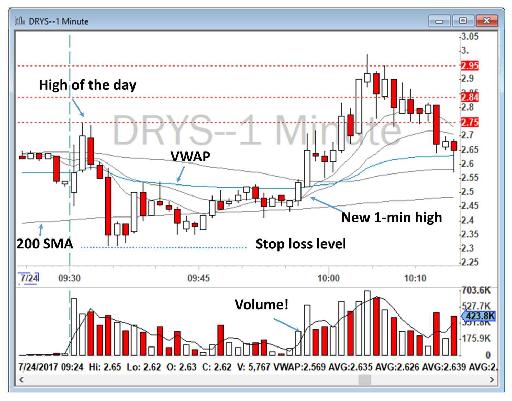
Figure 6.8 - 5-minute and 1-minute charts of DRYS on July 24, 2017 showing potential entry, exit and stop loss levels.
Another example of the Fallen Angel Strategy can be seen on Capricor Therapeutics Inc. (ticker: CAPR) on July 27, 2017, as set out in Figure 6.9. When the market opened at 9:30 a.m., CAPR quickly went up to $1.56, but then sold off quickly toward the low of the pre-market at around $1.30 to $1.35 and consolidated around that level. After the consolidation, it made a new 5-minute high as well as a new 1-minute high at 9:45 a.m. with heavy volume toward the then high of the day of $1.56 and the high of the pre-market of $1.63. After it tested the high of the pre-market, it sold off back below VWAP at around 10:05 a.m.
A good entry would have been around $1.40 with a stop loss below $1.30 and profit targets of $1.56 and $1.63 (a risk/reward ratio of approximately 2).
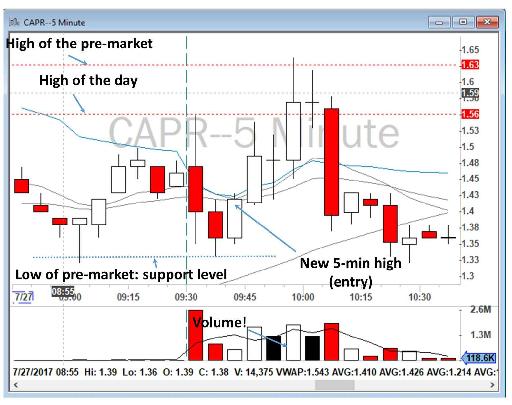
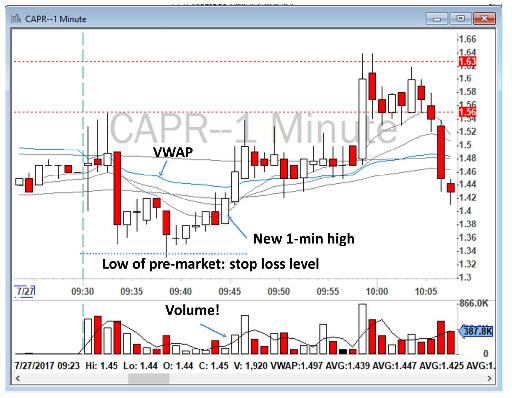
Figure 6.9 - 5-minute and 1-minute charts of CAPR on July 27, 2017 showing potential entry, exit and stop loss levels.
To summarize the strategy:
- An Angel is a low float Stock in Play which is gapping with heavy volume in the pre-market.
- At the market Open, our Angel makes a new high of the day but sells off quickly. You do not want to jump into the trade yet, not until it consolidates around an important trading level such as the low of the pre-market, or moving averages on your daily or 5-minute chart. This is where our Angel will have fallen to.
- As soon as the stock is coming back up with heavy volume, that is the place you take the trade to the long side. The entry signal is to see a new 1-minute or 5-minute high after the consolidation with MASSIVE volume only. You must remember that the volume on the way up needs to be significantly higher than previous candlesticks.
- The stop loss is below the consolidation period.
- The profit target can be (1) VWAP, (2) the then high of the day, (3) the high of the pre-market, and (4) any other important level nearby such as Y High or Y Low.
- If you don’t see an obvious support level and consolidation, do not trade the stock.
- If you see a breakout but it does not have strong volume, do not trade the stock.
Fallen Angel is generally a difficult strategy to trade, especially since it is difficult to manage the risk in. You will have seen in the above examples that most of the drops are sharp, and if you are not quick in getting out of a losing trade, you may get stuck in a very bad position and be forced to accept a heavy loss. Remember, these stocks often gapped up significantly and can lose the majority of their gap during the day, so holding them during the day may not be a good idea, especially if volume is dropping during the day. I recommend trading this strategy in the simulator for some period of time before trading it live. When you go live, make sure to take small size. I know, it is easy to take a 10,000 share on a $1 stock, but remember, every cent up and down in a $1 stock is the equivalent of a 1% swing in your position. I usually take 4,000 shares for low float stocks below $10.
Table of contents
- DISCLAIMER:
- Table of Contents
- Chapter 1: Introduction
- Chapter 2: The Trading Tools and Platform
- Chapter 3: Building Your Trading Watchlist
- Chapter 4: Support and Resistance Levels
- Chapter 5: Price Action, Candlesticks and Trade Management
- Chapter 6: Advanced Day Trading Strategies
- Chapter 7: Risk and Account Management
- Chapter 8: Conclusion and Final Words
- Glossary