Chapter 5:
Price Action, Candlesticks and Trade Management
A successful trader needs to learn how to extract information from price movements by monitoring what is happening in real time during the trading day and by studying past data. Therefore, this section reviews price action and the fundamentals of candlestick charts. Some parts of this section may be repetitive from my first book, but I have included more in-depth technical discussions regarding chart patterns and trade management.
It is known that in the 17th century the Japanese began using technical analysis and some early versions of candlesticks to trade rice. Much of the credit goes to a legendary rice trader named Homma from the town of Sakata, Japan. While these early versions of technical analysis and candlestick charts were different from today’s version, many of the guiding principles are actually very similar. Candlestick charting, as we know it today, first appeared sometime after 1850. It is likely that Homma’s original ideas were modified and refined over many years of trading, eventually resulting in the system of candlestick charting that we now use. Besides candlestick charting, there are other styles for representing price action including bars, lines, and point and figure. I personally, however, consider candlestick charts more visually appealing and easier to interpret.
In order to create a candlestick chart, you must have a data set that contains the (1) opening price, (2) highest price in the chosen time frame, (3) lowest price in that period, and (4) closing price values for each time period you want to display.
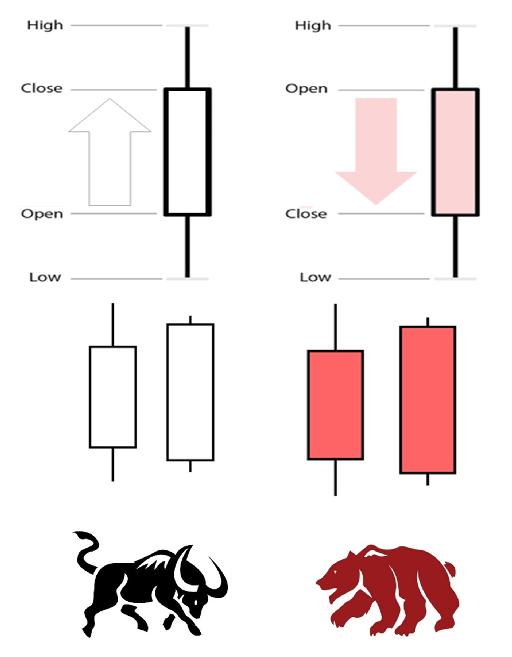
The time frame can be daily, 1-hour, 5-minute, 1-minute, or any other period you prefer. The hollow (white) or filled (red) portion of the candlestick is called “the body”. The long thin lines above and below the body represent the high/low range and are called “shadows” (also referred to as “wicks” and “tails”). The high is marked by the top of the upper shadow and the low by the bottom of the lower shadow. Two examples follow in Figure 5.1. If the stock closes higher than its opening price, a hollow candlestick is drawn with the bottom of the body representing the opening price and the top of the body representing the closing price. If the stock closes lower than its opening price, a filled (usually red) candlestick is drawn with the top of the body representing the opening price and the bottom of the body representing the closing price.

Figure 5.1 - Candlestick examples.
Each candlestick provides an easy-to-decipher picture of the price action. A trader can immediately compare the relationship between the open and close as well as the high and low. The relationship between the open and close is considered vital information and forms the essence of candlesticks.
Hollow candlesticks, where the close is greater than the open, indicate buying pressure. Filled candlesticks, where the close is less than the open, indicate selling pressure.
Table of contents
- DISCLAIMER:
- Table of Contents
- Chapter 1: Introduction
- Chapter 2: The Trading Tools and Platform
- Chapter 3: Building Your Trading Watchlist
- Chapter 4: Support and Resistance Levels
- Chapter 5: Price Action, Candlesticks and Trade Management
- Chapter 6: Advanced Day Trading Strategies
- Chapter 7: Risk and Account Management
- Chapter 8: Conclusion and Final Words
- Glossary