Real Time Intraday Scans
Sometimes you cannot find any good Stocks in Play on your Gappers watchlist. Sometimes many stocks will come into play after the market opens for a variety of reasons including the important and previously discussed breaking news. You often have no way to find those stocks in the pre-market. Therefore, it is important to have intraday scanners that show you active stocks after the market Open at 9:30 a.m.
Some traders have proprietary scanners to find these stocks. Depending upon a trader’s strategies, many different parameters can be set and various filters applied to define a scanner. I myself have a few simple scanners that are usually sufficient for me to find Stocks in Play. They are not complicated and follow only a handful of basic fundamental and technical rules. They have worked for me and they produce fairly good results every day. Many trading platforms offer scanners built into their software which you can use. There are also various online websites and vendors that offer both basic real time scanners and also more sophisticated ones.
There are many options to choose from. I personally use Trade Ideas software (www.trade-ideas.com) and I share my scanners with the traders in our community. It is a paid software and requires a monthly or annual subscription. They offer various packages and I recommend, if you are interested in this software, that you check their website.
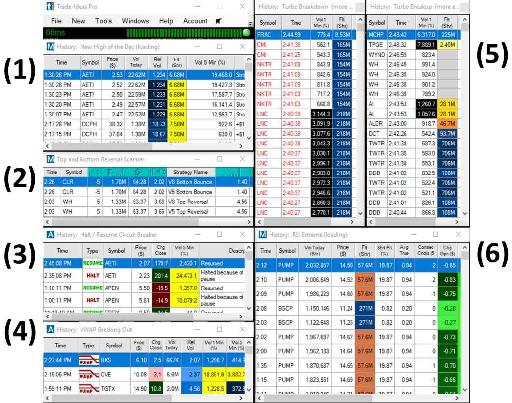
Figure 3.14 - Overview of my Trade Ideas scanners: 1) New High of the Day, 2) Top and Bottom Reversals, 3) Halt/Resume Circuit Breakers, 4) VWAP Breaking Out, 5) Turbo Breakdown and Turbo Breakup, 6) RSI Extreme.
Figure 3.14 is an overview of the scanners I use daily. In the next sections I will briefly review each one and explain their settings. For more details about each scanner, please check out our website and, if you are a member of our community, you can easily download my settings into your own Trade Ideas software.
New High of the Day
For the Bull Flag Strategy you need to find low float stocks that are moving. These stocks usually move toward extreme highs and make constant new highs of the day. You cannot find these stocks unless you are using a good intraday scanner that finds stocks that are vigorously making new highs of the day. To find these movers, I defined a New High of the Day Scanner in Trade Ideas that alerts me every time a stock that meets my criteria is making a new high of the day.
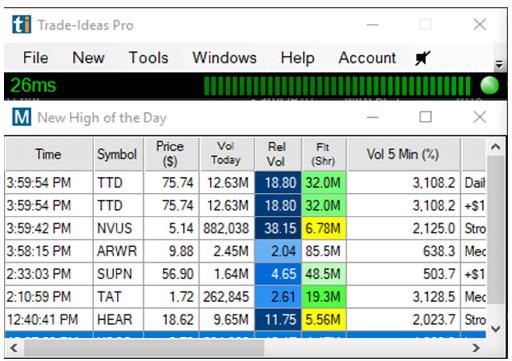
Figure 3.15 - Example of my New High of the Day Scanner.
Figure 3.15 shows an example of a New High of the Day (HOD) Scanner and Figure 3.16 is a screenshot of the configuration of that scanner on January 9, 2018. This is how I find in real time the low float stocks that are making new highs of the day that meet the following filter criteria:
- Price range: $1 to $10
- The volume today is at least 200,000 shares
- The float is a maximum of 10,000,000 shares
- The volume in the last 5 minutes is between 400% and 2,000% of normal
- The current volume is at least 2 times the normal average volume
- The 15-minute range is at least $0.30
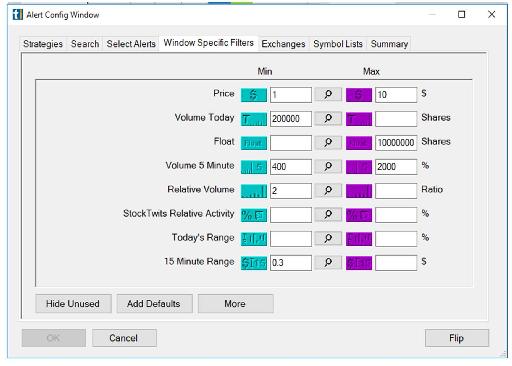
Figure 3.16 – The configuration of my intraday real time New High of the Day Scanner on January 9, 2018.
Top and Bottom Reversal Scanners
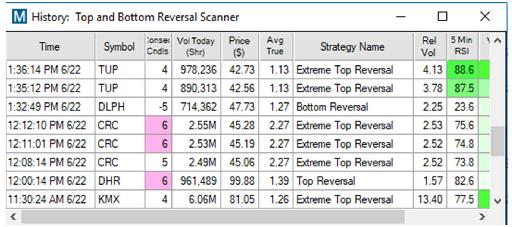
Figure 3.17 – My intraday real time Top and Bottom Reversal Scanner.
Top and Bottom Reversal Strategies are two strategies that you cannot find stocks for in the pre-market. You must have an intraday real time scanner. Figure 3.17 is an image of my Top and Bottom Reversal Scanner and Figure 3.18 is an image of the settings I use.
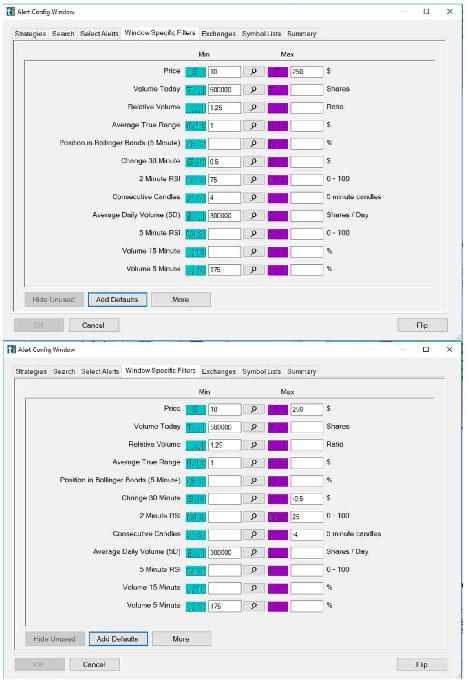
Figure 3.18 – A) My setting for my Top Reversal Scanner, B) My setting for my Bottom Reversal Scanner.
As you can see, I am scanning the market real time to find stocks that are selling off or surging up, so that I can trade my Reversal Strategies. You can read more about these strategies in Chapter 6.
I included a screenshot of how these scans are made, but I won’t go into the details here about how to make these scans. I will explain in Chapter 6 under each strategy the specifics of what to look for in stocks in each category. If you develop new strategies for yourself, you can also define new scanners for yourself. These scanners are highly adjustable and you can change the parameters as you like. These are the parameters that work for me, but as you gain experience and learn more about other strategies and your trading style, you may very well decide to define new scanners for yourself.
Many new traders don’t initially need a scanner. If you join a community of day traders such as mine, you will be able to see my scanner in real time. These scanners are costly, around $100 per month, so at the beginning of your career transition to day trading, you will probably want to keep your expenses down as much as possible.
VWAP Breaking Out
Another simple scanner that I defined is the VWAP Breaking Out. This scanner alerts me when a Stock in Play crosses the VWAP with high volume in either an up or down direction. Figure 3.19 shows both the scanner and its configuration.
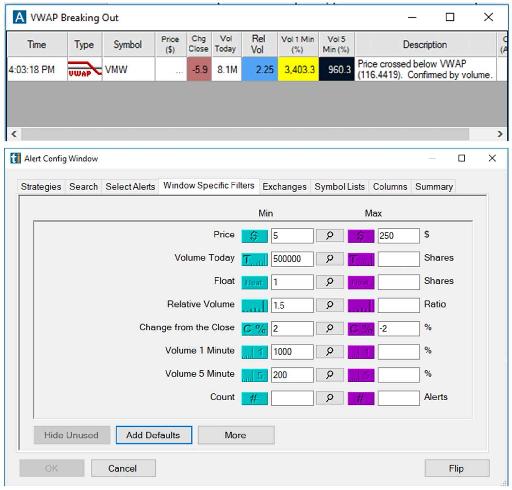
Figure 3.19 – My VWAP Breaking Out Scanner and its configuration.
As I will explain in Chapter 6, VWAP is the most important day trading indicator and Stocks in Play can be traded based on the VWAP Strategies set out in Chapter 6.
An example of using this scanner is illustrated in Figure 3.20 in a trade I took on March 2, 2018 on JD.com, Inc. (ticker: JD). JD gapped down from a previous day close of $43.81 and was trading at around $42 in the pre-market. At the Open, it pushed higher but bounced at the previous day close of $43.81. As I will explain in Chapter 4, the previous day close is an important support and resistance level.
JD failed to break the previous day close and moved toward a low of the day. It crossed the VWAP with heavy volume and it hit my scanner at 9:37:29 a.m.
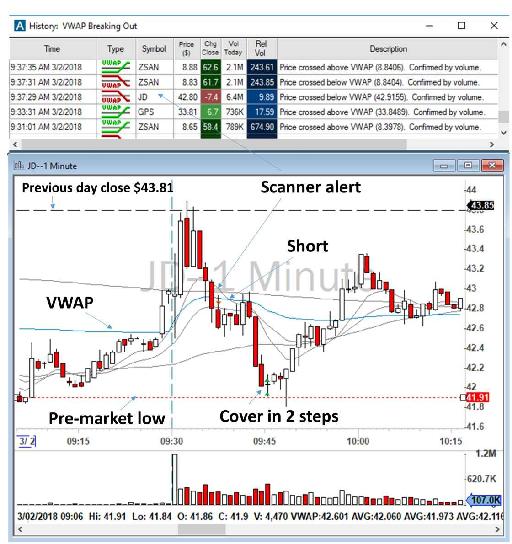
Figure 3.20 - Example of trading JD utilizing my VWAP Breaking Out Scanner.
I evaluated the price action and took a 1,000-share short position at $42.80 with a stop loss at $43. The price dropped sharply to a pre-market level of $41.91 and I covered my shorts for a good profit of $1,375.92 in about only 20 minutes, as shown in Figure 3.21, the screenshot of my P&L.
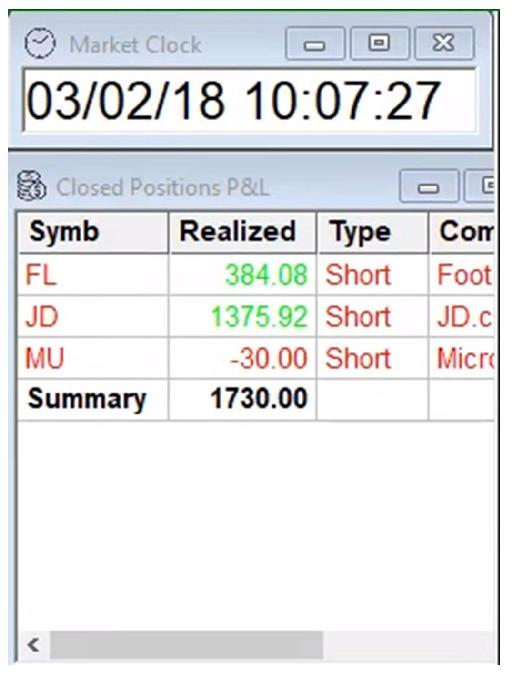
Figure 3.21 – Screenshot of my P&L showing the results of my trade on JD.
Turbo Breakdown and Turbo Breakup
When a Stock in Play makes a new high of the day, it is usually with extremely high relative volume. There are many stocks that make new highs or new lows of the day, but often these moves are not happening with high relative volume.
To filter only the important moves, I defined two simple yet effective scanners. The Turbo Breakdown filter finds Stocks in Play that are moving down to make a new low of the day with unusual 1-minute volume. Similarly, the Turbo Breakup filter finds stocks that are making a new high of the day with unusual 1-minute volume. Figure 3.22 shows the settings for these two scanners.
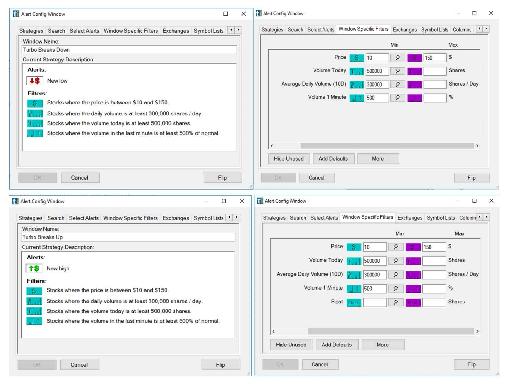
Figure 3.22 - The configurations of my Turbo Breakdown and Breakup Scanners.
An example of these scanners at work can be seen in Figure 3.23. On March 2, 2018, one day after U.S. President Donald Trump announced a plan to impose global duties on imported aluminum and steel, the European Union announced a retaliation plan by applying 25% tariffs on a list of U.S. products ranging from bourbon to Harley-Davidson motorbikes.
“We will put tariffs on Harley-Davidson, on bourbon and on blue jeans - Levis,” European Commission President Jean-Claude Juncker told German television.
No investor in the financial market wants a trade war. As soon as the news came out at 11:47 a.m., Harley-Davidson Inc. (ticker: HOG) started to sell off. HOG was not on my watchlist that day, and it had had no trading activity before that news announcement. However, at 11:48 a.m., it hit my Turbo Breakdown Scanner, with HOG’s share price dropping from $44.20 to $43.45.
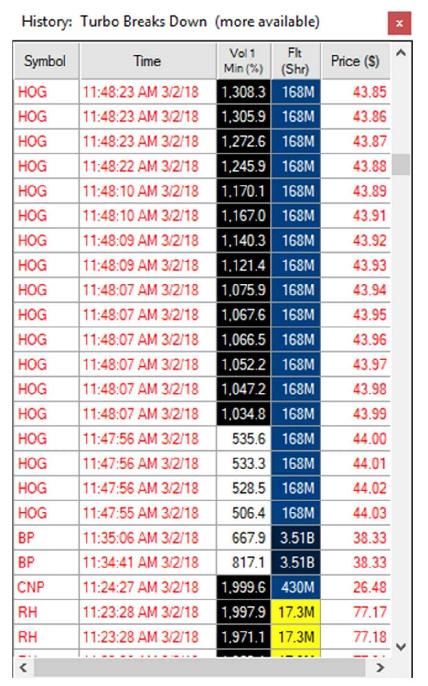
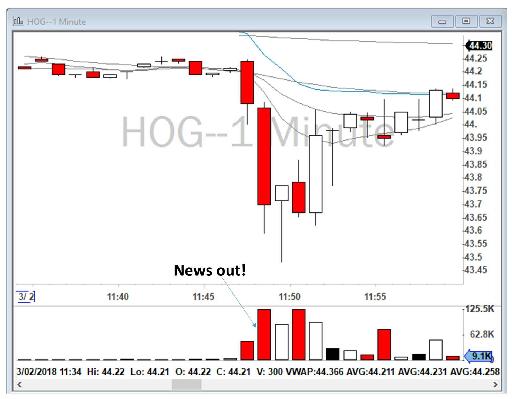
Figure 3.23 - HOG hits my Turbo Breakdown Scanner on March 2, 2018.
Another example was a trade I did on JD on March 5, 2018 where I took an Opening Range Breakout from VWAP to a profit target of $42.04 which happened to be 200 SMA on my daily chart. As shown in Figure 3.24, 200 SMA on a daily chart is a strong support and resistance level (see Chapter 4 for further information).
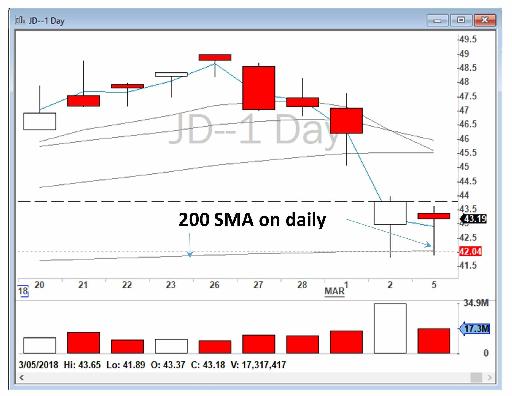
Figure 3.24 – Daily chart for JD on March 5, 2018 showing 200 SMA as a strong support and resistance level.
I did not have any stocks listed on my Gappers watchlist on the morning of March 5, 2018, and I was hoping I could find something from my real time scanners. Just after the market Open, JD hit my Turbo Breakdown Scanner with heavy volume and I saw an excellent short opportunity below VWAP to the 200 SMA on a daily chart, as shown in Figure 3.25.
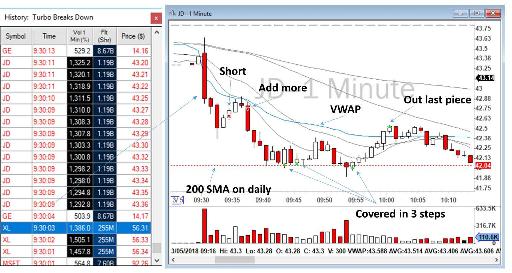
Figure 3.25 - JD hit my scanner on March 5, 2018, even though it was not on my watchlist. I took an Opening Range Breakout from VWAP to a profit target of $42.04.
As shown in Figure 3.26, it was a nice trade with an even nicer profit, thanks to Trade Ideas!
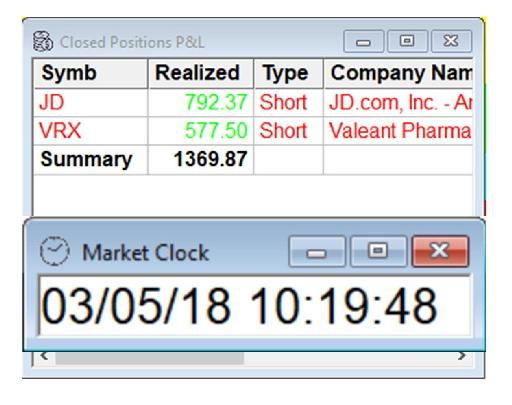
Figure 3.26 – Screenshot of my P&L showing the results of my trade on JD.
Circuit Breaker Halts
Low float stocks can make extreme intraday moves. I have seen low float moves from $1 to over $100 during only one trading day. Although day traders love volatility in the market, this kind of volatility is dangerous for the market and most importantly for investors. Sometimes when breaking news is released, volatility will increase significantly due to the confusion it has caused. To stabilize the market and to protect investors, the exchanges and the authorities may limit the excessive volatility of the price in either direction by temporarily halting trading of the individual stock. The U.S. Securities and Exchange Commission (SEC) has defined a “limit-up” and “limit-down” to determine the thresholds for acceptable trading. Circuit breaker halts are triggered by up or down moves outside of certain bands which are determined based on the price of the stock and its listing condition. The exact threshold varies for different stocks but typically a 15% rise in a company's share price over five minutes can cause a circuit breaker halt.
Usually these halts are for 5 minutes and then trading is resumed. If volatility remains in the price though, the exchange will continue to halt trading in the stock until the price volatility returns back into the acceptable threshold. More often than not, wild moves in a stock’s price will end after two or three halts and resumptions. In the case of breaking news, sometimes the exchange might halt trading until the company issues an official press release and clarifies the news for investors.
As day traders, we are always on the hunt for volatility. Therefore, I have defined a Circuit Breaker Scanner that alerts me whenever a stock halts due to extreme volatility. For example, on March 2, 2018, Innovate Biopharmaceuticals Inc. (ticker: INNT) moved from $6 to almost $15 during the day. This extreme volatility led to the halting and then resumption of trading several times during the day, as shown in Figure 3.27.
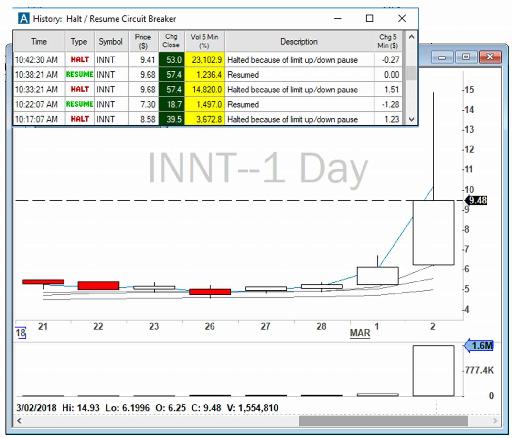
Figure 3.27 - INNT Circuit Breaker Halt/Resume Scanner alert on March 2, 2018.
RSI Extreme
The Relative Strength Index (RSI) is a momentum indicator that compares the amount of gains and losses of a stock over a specified time period (for example 5-minutes or daily) to measure the speed and change of price movements. Daily RSI is often used by swing traders to identify overbought or oversold price ranges, while 5-minute or 15-minute RSI ranges are sometimes used by day traders to find potential reversal opportunities. RSI values range from 0 to 100. Traditionally, RSI values of 70 or above indicate that a stock is becoming overbought or overvalued, and therefore may be prime for a reversal or pull back. On the other hand, an RSI reading of 30 or below can indicate an oversold or undervalued condition that may signal a trend change or corrective price reversal to the upside.
I set my RSI Extreme Scanner in a way that only shows stocks which are entering an extreme range of either above 90 or below 10 within a 5–minute time frame. Figure 3.28 shows the settings for my RSI Extreme Scanner. I am only looking for stocks that have at least 1 million shares being traded in that day, in the range of $10 to $100, with an RSI over a 5-minute time frame in the range of below 10 or above 90.
I have found that almost all of the stocks which hit my RSI Extreme Scanner during the day are Stocks in Play. I may not necessarily trade them all, but they often do provide good trading opportunities.
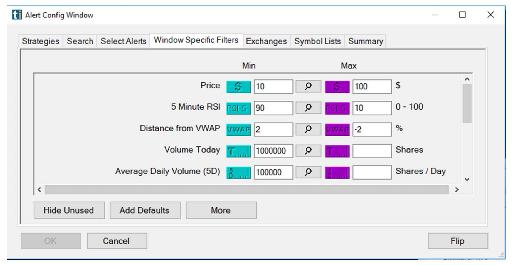
Figure 3.28 - Configuration of my RSI Extreme Scanner.
Table of contents
- DISCLAIMER:
- Table of Contents
- Chapter 1: Introduction
- Chapter 2: The Trading Tools and Platform
- Chapter 3: Building Your Trading Watchlist
- Chapter 4: Support and Resistance Levels
- Chapter 5: Price Action, Candlesticks and Trade Management
- Chapter 6: Advanced Day Trading Strategies
- Chapter 7: Risk and Account Management
- Chapter 8: Conclusion and Final Words
- Glossary