Strategy 3: Bull Flag / Bear Flag
The Bull Flag Strategy is essentially an ABCD Pattern, but the term is used by some traders mostly on low float stocks under $10 (Chapter 3). I made it a different strategy in this and my previous book in order to emphasize the differences. All of the tactics are essentially the same as for the ABCD Pattern. The only real difference between these two strategies is the duration of the trade. Bull Flags often happen much faster, and the trades are very volatile, and therefore it is more difficult to manage the risk. It definitely requires a fast execution platform and a quick decision-making process. I always encourage new traders to avoid trading low float stocks at the beginning of their career.
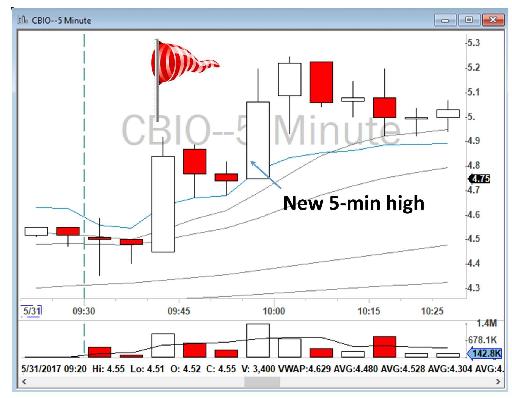
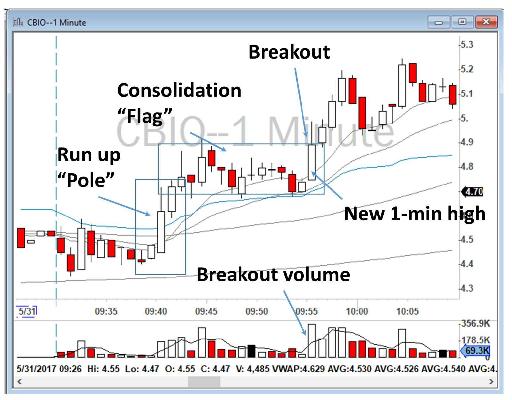
Figure 6.20 - Example of a Bull Flag formation with one consolidation period on CBIO. The Bull Flag can be seen on both the 1-minute and 5-minute charts.
This pattern, shown above in Figure 6.20, is named Bull Flag because it resembles a flag on a pole. In Bull Flag, you have one or several large candles going up (like a pole), and you also have a series of small candles moving sideways (like a flag), or, as we day traders say, “consolidating”. Consolidation means that the traders who bought stocks at a lower price are now selling and taking their profits. Although that is happening, the price does not decrease sharply because the buyers are still entering into trades and the sellers are not yet in control of the price. Many traders who missed buying the stock before the Bull Flag started will now be looking for an opportunity to take a trade. As soon as the price starts breaking up in the consolidation area with heavy volume, you can begin going long. Patience truly is a virtue.
But how do you find a Bull Flag? Our community uses a simple yet effective scanner in Trade Ideas that shows us low float stocks that make a new high of the day. Usually, the running up phase (pole phase) is the time that a stock will also make a new high of the day. So, by just scanning for stocks that make a new high of the day with heavy relative volume, it is possible to find Bull Flags before their consolidation period.
When a low float stock hits your scanner, you should not just jump into the trade. Wise traders know that it is risky to buy a stock when the price is “running up”. That’s called chasing the stock. Professional traders aim to enter the trade during quiet times and take their profits during the volatile times. That is the total opposite of how amateurs trade. They jump in or out when stocks begin to run, but grow bored and lose interest when the prices are, shall I say, sleepy. Chasing the stocks is an account killer for beginners.
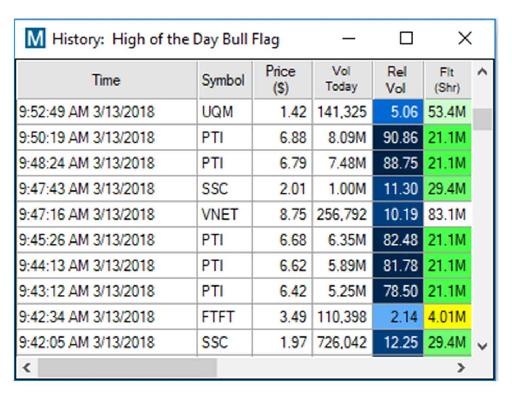
Figure 6.21 - Example of my New High of the Day Scanner.
For example, let’s review the scanner alert of March 13, 2018 for Proteostasis Therapeutics, Inc. (ticker: PTI). As shown in Figure 6.21, the first alert hit my scanner at 9:43:12 a.m. When this happens, you should check your charts and wait for an excellent opportunity. Just because an alert hits your scanner does not mean the stock is suitable at that moment for trading. In fact, 95% of my scanner alerts are generally not tradeable; only 5% provide an excellent risk/reward opportunity. Experienced traders will wait until they can find a solid consolidation. Your goal is to enter the trade at a breakout with volume. In this instance, it took about 12 minutes. The true breakout happened at 9:55:10 a.m. when PTI moved from $6.90 to over $7.20 with heavy volume, as shown in Figure 6.22. The volume of shares traded is significantly higher after consolidation, which is a confirmation for a long entry.
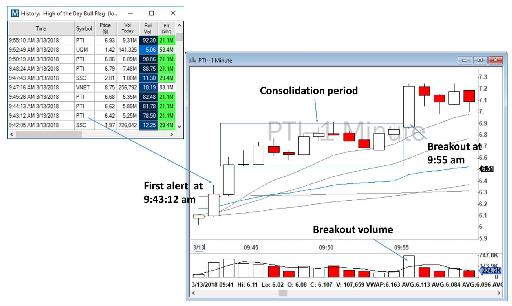
Figure 6.22 - Scanner alert on PTI and accompanying 1-minute chart.
Usually a Bull Flag will show several consolidation periods. I only enter in during the first and second consolidation periods. Third and higher consolidation periods are risky because the price has probably been very extended in a way that indicates that the buyers will soon be losing their control. Let’s study an example in Figure 6.23 below, a Bull Flag on RIGL on August 30, 2016.
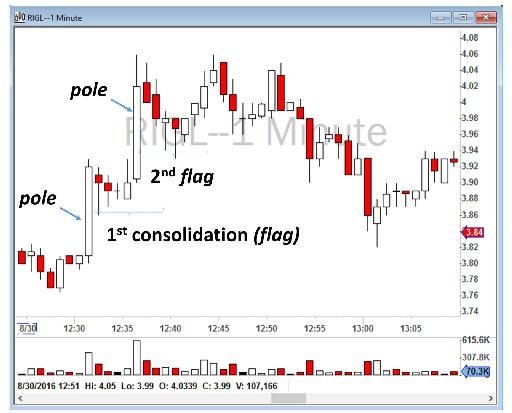
Figure 6.23 - Example of Bull Flag formation with two consolidation periods on RIGL.
This is an example of two Bull Flag Patterns. It is normally hard to catch the first Bull Flag, and you will probably miss it, but as explained above, your scanner should alert you to it so that you can be ready for the next Bull Flag.
My scanner showed RIGL at 12:36:15 p.m. As soon as I saw that, I realized that there was also a very high relative volume of trading (120 times the normal trading volume), which made this a perfect setup for day trading. I waited for the first consolidation period to finish and, as soon as the stock started to move toward its high for the day, I jumped into the trade. My stop loss was the breakdown of the consolidation period. I marked my exit and entry in Figure 6.24 below.
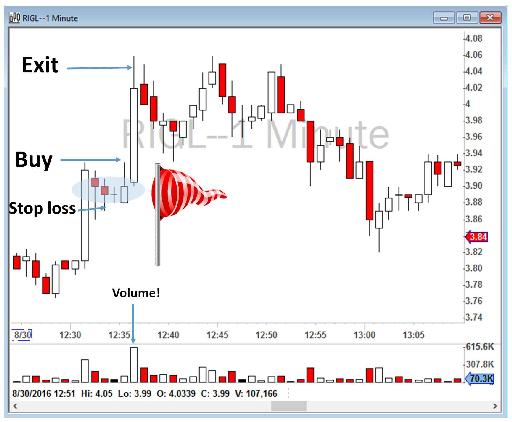
Figure 6.24 - Entry, stop and exit for a Bull Flag Strategy on RIGL.
Another Bull Flag example can be seen on NVFY on April 6, 2017, as set out in Figure 6.25. You will notice that NVFY ran up at the Open making a strong move from $1.85 to over $2.30. It showed a consolidation for about 20 minutes and then eventually broke the consolidation with a new 5-minute high and heavy volume toward $2.60.
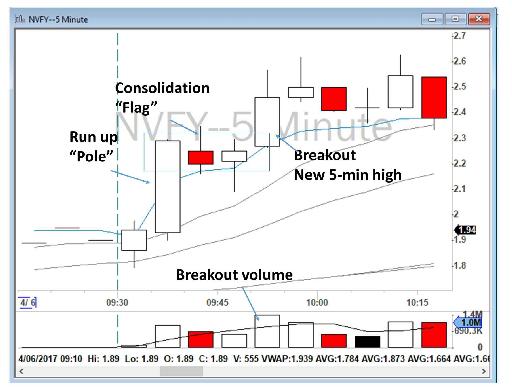
Figure 6.25 - Example of a Bull Flag on NVFY.
An additional Bull Flag example can be seen on AEZS on July 19, 2017, as set out in Figure 6.26. You will notice that AEZS ran up shortly after the Open and then showed a consolidation for about an hour before eventually breaking the consolidation with a new 5-minute high and heavy volume. Shortly after 12 noon, a second Bull Flag occurred which then broke free to make yet another new 5-minute high and again with heavy volume.
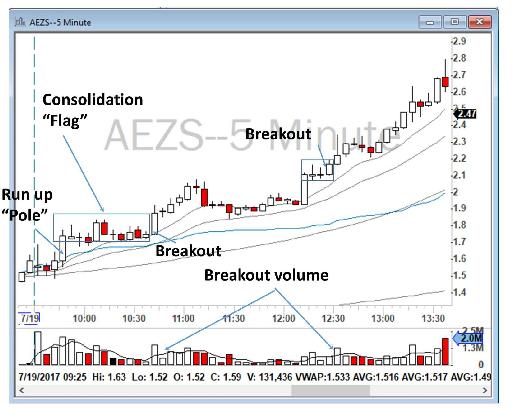
Figure 6.26 - Example of a Bull Flag on AEZS.
To be successful in trading this strategy, a perfect entry is essential. A bad entry will very likely create a bad risk/reward ratio, and will potentially cause a severe loss. To make a good entry when executing the Bull Flag Strategy, you must successfully recognize the consolidation period on both your 1-minute and 5-minute charts. If you cannot see clearly that the stock is consolidating or going up or selling off, then it is better to avoid trading the stock at that moment. It could mean that the stock is too choppy to trade.
After you successfully recognize the consolidation period, you need to look for new 1-minute and 5-minute highs with increasing volume. Sometimes a new 1-minute high shows a good entry, but often the best entry is when these two are together in a way so that a new 1-minute candlestick coincides with a new 5-minute high with heavy volume, as shown in Figure 6.27 re. AEZS and HMNY.
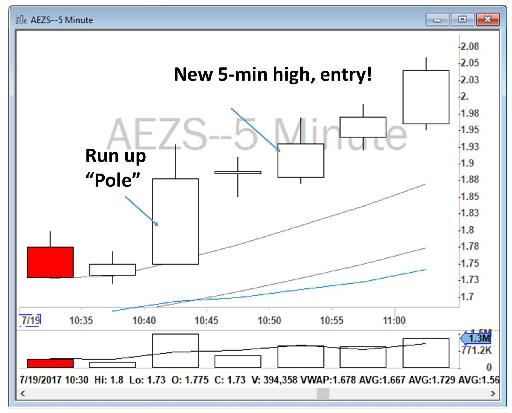
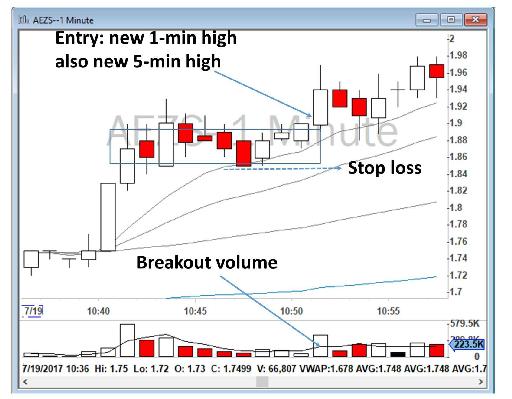
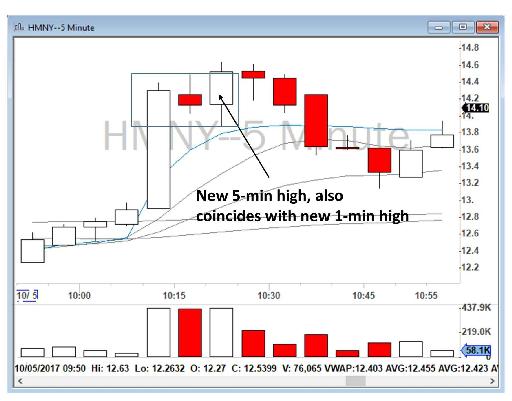
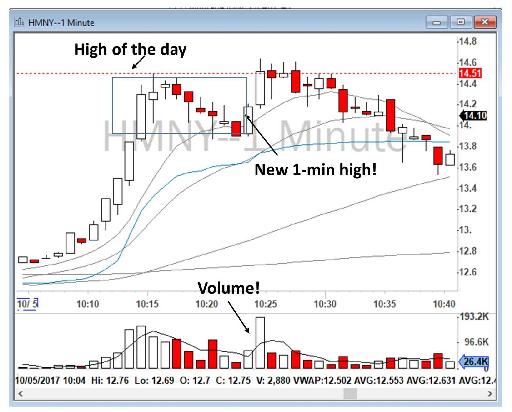
Figure 6.27 - Entry points for AEZS and HMNY are where both 5-minute and 1-minute charts make a new high (compared to previous candlesticks) with strong volume. Usually 1-minute highs are easier to distinguish.
To summarize my trading strategy:
- When I see a stock surging up (either on my real time New High of the Day Scanner or when advised by someone in our chatroom), I patiently wait until I can identify a clean consolidation period. I do not jump into the trade right away (you will recall that is the dangerous act of “chasing the stock”) because I cannot put a proper stop loss if I am chasing the stock.
- I watch the stock during the consolidation period. I choose my share size and stop loss and exit strategy.
- As soon as prices are moving over the high of the consolidation candlesticks, I enter the trade. My stop loss is the break below the consolidation periods. The perfect entry is when both 1-minute and 5-minute charts make a new high at the same time (compared to previous candlesticks). It is therefore important when executing a trade in this strategy to be looking at both charts at the same time.
- I sell half of my position and take a profit on the way up, usually with a break of the high of the day. I bring my stop loss from the low of the consolidation period to my entry price (break-even).
- I sell my remaining positions as soon as my target hits or I sense that the price is losing steam and the sellers are gaining control of the price action.
- If there is no profit target, you can look at your 1-minute or 5-minute chart and close your position when the price makes a new 1-minute or 5-minute low. This is ideally when the price will roll over and the trend will change.
If you look closely, the Bull Flag is essentially an ABCD Pattern that will happen more often on low float stocks. However, in a Bull Flag Strategy for stocks under $10, many traders buy only at or near the breakout (the opposite to how the ABCD Pattern is traded with medium float stocks). The reason for this is because moves in low float stocks are very fast and they will fade away very quickly. Therefore, Bull Flag is more or less a Scalping Strategy. Scalpers buy when a stock is running. They rarely like to buy during consolidation (during that waiting and holding phase). These types of stocks usually drop quickly and brutally, so it is important to jump in only when there is a confirmation of breakout. Waiting for the stock to break the top of a consolidation area is a way of reducing your risk and exposure time in low float stocks. Instead of buying and holding and waiting, which increases exposure time, scalpers just wait for the breakout and then send their order. They get in, scalp, and get out quickly. That’s the philosophy of momentum scalpers.
The Bull Flag Pattern is a long-based strategy that is found within an uptrend in a stock. A similar approach, the Bear Flag, can also be defined, but in reverse for short selling. I personally don’t trade Bear Flag, because often my broker does not have low float stock shares available for short selling. In addition, short selling low float stocks is risky because of their potential to squeeze significantly to the upside.
Overall, trading low float stocks is very difficult and dangerous and beginners should be very careful if trading them. If you choose to, as I earlier cautioned, trade only in a small size and only after sufficient practice in your simulator. You will also need a super-fast execution system for trading these fast-moving stocks. Paradoxically, many beginners start with trading these low float stocks and are then forced to end their career before it even properly began.
I recommend new traders stay away from low float stocks, build their account and confidence with medium float stocks, and then slowly move toward trading low float stocks in small sizes. Remember, if you get caught on the wrong side of the trade in these low float stocks, it usually does not end well for your account.
Table of contents
- DISCLAIMER:
- Table of Contents
- Chapter 1: Introduction
- Chapter 2: The Trading Tools and Platform
- Chapter 3: Building Your Trading Watchlist
- Chapter 4: Support and Resistance Levels
- Chapter 5: Price Action, Candlesticks and Trade Management
- Chapter 6: Advanced Day Trading Strategies
- Chapter 7: Risk and Account Management
- Chapter 8: Conclusion and Final Words
- Glossary