Strategy 5: VWAP Trading
What is VWAP?
Volume Weighted Average Price, or VWAP, is the most important technical indicator for day traders. VWAP is calculated by adding up the dollars traded for every transaction (price multiplied by number of shares traded) and then dividing by the total shares traded for the day.
I will skip explaining VWAP in mathematical terms, but essentially, VWAP is a moving average that takes into account the volume of the shares being traded at any price. Other moving averages are calculated based only on the price of the stock on the chart, but VWAP also considers the number of shares in that stock that are being traded on every price. Your trading platform should have VWAP built into it and you can use it without changing any of its default settings.
VWAP is an indicator of who is in control of the price action - the buyers or the sellers. When a stock is traded above the VWAP, it means that the buyers are in overall control of the price and there is a buying demand on the stock. When a stock price breaks below the VWAP, it is safe to assume that the sellers are gaining control over the price action.
VWAP is often used to measure the trading performance of institutional traders. Professional traders who work for investment banks or hedge funds and need to trade large numbers of shares each day cannot enter or exit the market by just one single order. The market is not liquid enough for the trader to enter a one million share buy order. Therefore, they need to liquidate their orders slowly during the day. After buying or selling a large position in a stock during the day, institutional traders compare their price to VWAP values. A buy order executed below the VWAP would be considered a good fill for them because the stock was bought at a below average price (meaning that the trader has bought their large position at a relatively discounted price compared to the market). Conversely, a sell order executed above the VWAP would be deemed a good fill because it was sold at an above average price. Therefore, VWAP is used by institutional traders to identify good entry and exit points.
Institutional traders with large orders try to buy or sell large positions around VWAP. The performance of institutional traders is often evaluated based on what price they fill their large orders at. Traders who buy significantly higher than VWAP may be penalized because they cost their institution money for taking that large position. Institutional traders therefore try to buy below or as close to VWAP as possible. Conversely, when a professional trader has to get rid of a large position, they try to sell at the VWAP or higher. Day traders who know this may benefit from this market activity.
After the market opens, the Stock in Play will trade heavily in the first five minutes, often at or around the VWAP. If the Stock in Play has gapped up, some individual shareholders, hedge funds or investment banks may want to sell their shares as soon as possible for a profit, before the price drops. At the same time, some investors wanting to take positions in the stock want to buy as soon as possible, before the price goes even higher. Therefore, in the first five minutes, an unknown heavy trading is happening between the overnight shareholders and the new investors. Scalpers usually ride the momentum right at the Open. After volatility decreases around ten to fifteen minutes into the Open, the stock will move toward or away from the VWAP. This is a test to see if there is a large investment bank waiting to buy or sell. If there is a large institutional trader aiming to buy a significant position, the stock will pop over the VWAP and move even higher. This is a good opportunity for us day traders to go long.
Conversely, if there are large shareholders wanting to get rid of their shares, then this is a good point for them to liquidate their positions. They start selling their shares at the VWAP. The price will reject the VWAP and start to move down. This is an excellent short selling opportunity for day traders. If there is no interest in the stock from market makers or institutions, the price may trade sideways near VWAP. Wise traders will then stay away from that stock.
Trading based on VWAP can be very easy for beginner traders to master because so many traders study the VWAP and make decisions based on it. Therefore, a beginner trader can easily be on the right side of the trade. When a stock tries to break the VWAP but cannot, you can short the stock because you can safely assume that the other traders that are watching will also begin to short. A trading strategy based on VWAP is a simple and easy strategy to follow. I usually short stocks when traders try but fail to break the VWAP on 5-minute charts.
Let's have a look now at Figure 6.32 which documents a trade that I took on SolarCity Corporation (ticker: SCTY) on June 24, 2016.
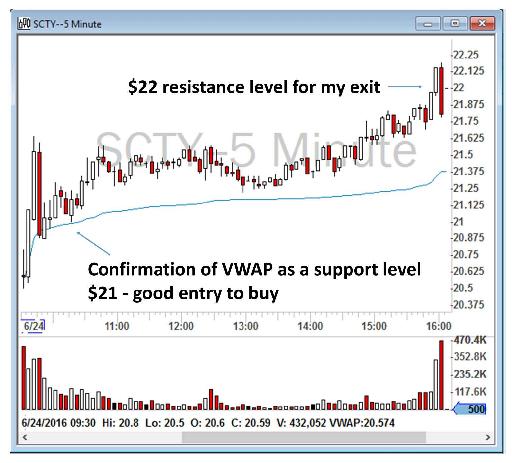
Figure 6.32 - Example of a long VWAP Strategy on SCTY.
At around 10:30 a.m. on June 24, 2016, I noticed that SCTY had found a support above VWAP at around $21. I purchased 1,000 shares of the stock with the anticipation of moving toward $22 with VWAP as a support. My stop was a 5-minute candlestick close below VWAP. I first sold a half-size position at $21.50, and then moved my stop to break-even. I sold another position at $22 because I know half-dollars (such as $1.50, $2.50, $3.50) and whole dollars ($1, $2, $3) usually act as a support and resistance level.
VWAP also works well when you want to short stocks. Let's have a look at Figure 6.33, which documents another trade that I took on SCTY, this time on June 22, 2016, and this time on the short side.
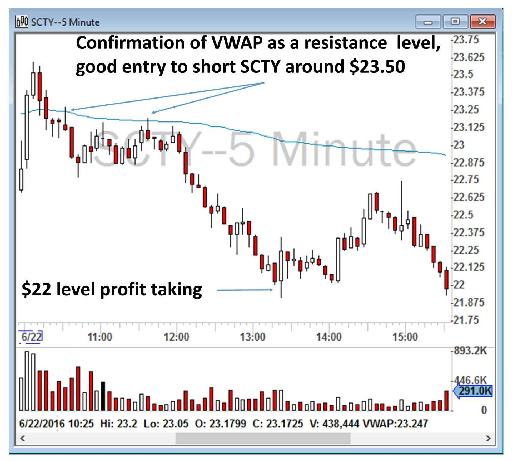
Figure 6.33 - Example of a short VWAP Strategy on SCTY.
At around 11 a.m., I noticed that SCTY had faced a resistance over VWAP. I shorted the stock with the anticipation of losing the VWAP at around $23. At around 12 p.m., the buyers gave up and the sellers took control of the price action. I had a nice run down to $22 and covered my shorts at $22 for a good $1,000 profit.
The above examples clearly demonstrate how VWAP is one of the most important indicators for day trading. Do note though that VWAP is only an intraday indicator; VWAP has no meaning on daily or weekly charts.
You may correctly ask then, how do I use VWAP for day trading? I use VWAP as an important support and resistance level for entry and stop loss levels as well as for profit target. I also have three strategies based on VWAP which I will explain below: (1) VWAP False Breakouts, (2) VWAP Reversals, and (3) VWAP Moving Average Trend.
VWAP False Breakout
My favorite trading strategy is the so-called VWAP False Breakout. VWAP False Breakouts will usually occur in the Late-Morning session, after 10:30 a.m., and continue on into the early afternoon. As shown in Figure 6.32, a strong Stock in Play will stay and trade above VWAP if there is buying pressure from institutional traders. If a large investment bank is interested in taking the position, a stock will often stay above VWAP and keep moving above VWAP, such as shown in Figure 6.32 on SCTY. But if there are no large institutions behind the stock, or if they fill all of their orders and are gone in the morning session, then the stock will move back to VWAP and often “lose it”, meaning it will drop and trade below the VWAP. This is a sign for short sellers to start shorting it.
A stock that has lost its big buyers during the morning session and has lost the VWAP is like a strong but bleeding buffalo that now has run out of breath. The wolves will patiently bide their time, waiting and watching, ready for the final ambush. Similarly, day traders can “smell the blood” as soon as a strong Stock in Play that has been above the VWAP suddenly loses the VWAP. Short sellers then will go after the stock to short it.
Continuing with the same example, day traders look for weak stocks to sell short like scavenging vultures waiting for the wolves to be finished feasting on that unfortunate buffalo. On the other hand, when a weak stock below the VWAP is coming back up and gains toward and above the VWAP and beyond, short sellers desperately have to cover. Smart day traders chase the fleeing shorts by going long to ride the momentum and “squeeze the shorts”.
Let’s review Figure 6.34, the trading behavior of AAOI on April 19, 2017. As you can see, the stock opened weak and sold below the VWAP toward a daily level of $43.61. After bouncing back from that resistance level three times, it eventually traded above VWAP from around 11:45 a.m. to 12:15 p.m. However, AAOI was not strong enough to stay above the VWAP and establish a moving average uptrend above it. It therefore bounced back from the previous day close of $44.20 (as you will recall from Chapter 4, the previous day close can be a very strong support and resistance level) and then lost the VWAP and traded below the VWAP again. That VWAP False Breakout signals a trading opportunity to go short below the VWAP, for example around $43.75, with a stop loss above VWAP. The first profit target could be the new low of the day, and then later the next daily level of $43.21, as marked in Figure 6.34.
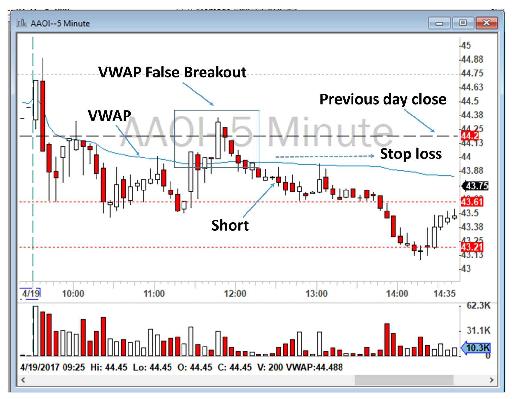
Figure 6.34 - Example of VWAP False Breakout on AAOI.
Another example can be seen in Figure 6.35, showing trading on May 12, 2017 for the American giant department store chain Nordstrom, Inc. (ticker: JWN). As you can see, JWN opened weak and sold below the VWAP toward a daily level of $41.52. After bouncing back from that resistance level, it bounced back to above VWAP and traded above the VWAP from around 10:05 a.m. to 10:45 a.m. However, JWN was not strong enough to stay above the VWAP to establish a moving average uptrend. It bounced back from the very strong resistance level of 50 Simple Moving Average (50 SMA) and lost the VWAP. That could signal a trading opportunity to go short below the VWAP, for example around $42.20, with a stop loss above VWAP. The first profit target could be when JWN made a new low of the day, and then later the next daily level of $41.52, as marked in Figure 6.35.
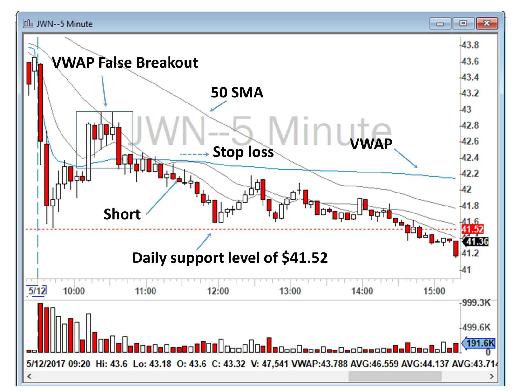
Figure 6.35 - Example of VWAP False Breakout on JWN.
Continuing with this discussion of American retail stores, let’s review Figure 6.36, the trading of Target Corporation (ticker: TGT) on May 17, 2017. TGT gapped up in the pre-market because of a good earnings report, but opened really weak and sold off below the VWAP toward $55.50, perhaps because of the heavy profit taking of investors and overnight swing traders. However, buyers jumped in at around 10 a.m. and TGT bounced back strongly after formation of a strong Bullish Engulfing Pattern (Chapter 5) and traded above VWAP from around 10:05 a.m. to 10:30 a.m. TGT was not strong enough though to stay above VWAP to establish a moving average uptrend. It quickly sold off and lost the VWAP. That could signal a trading opportunity to go short below VWAP, for example around $56.13, with a stop loss above the VWAP. The first profit target could be when TGT made a new low of the day, and then later the 200 SMA on the 5-minute chart, as it in fact did sell off toward by 1:35 p.m., as marked in Figure 6.36.
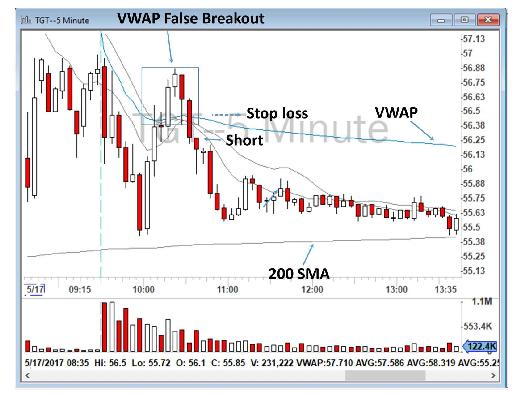
Figure 6.36 - Example of VWAP False Breakout on TGT.
Another clear VWAP False Breakout example is shown in Figure 6.37 for Adobe Systems Incorporated, the American computer software company (ticker: ADBE), on June 21, 2017. ADBE opened strong and squeezed above the VWAP, but the buyers lost the battle and it closed below the VWAP. The sellers initially took control of the price and pushed the price to the low of the day of $144.23. However, ADBE reversed back toward the VWAP and traded above it from 10 to 10:30 a.m. At around 10:30 a.m., the price bounced back from 20 EMA to below the VWAP. I took the trade short below the VWAP with a stop loss above it. The first profit target was the then low of the day of $144.23 and the final profit target was 200 SMA on the 5-minute chart. I was not patient enough for that profit target, but later at around 12:25 p.m., it hit the 200 SMA at around $143.50.
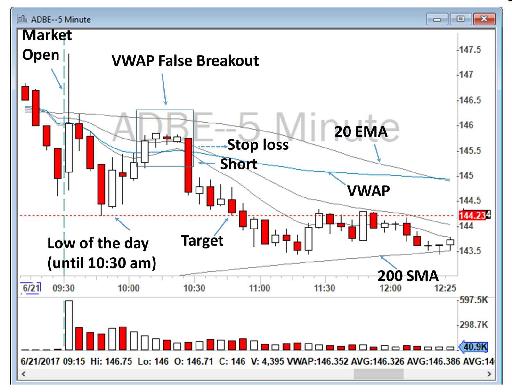
Figure 6.37 - Example of VWAP False Breakout on ADBE.
Another perfect illustration is shown in Figure 6.38 for the famous retailer, Bed Bath & Beyond Inc. (ticker: BBBY) on June 23, 2017. Can you identify the VWAP False Breakout?
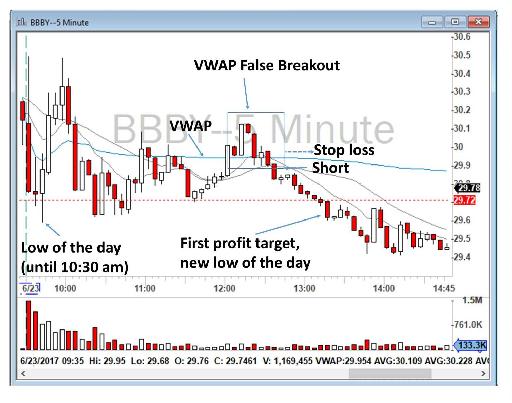
Figure 6.38 - Example of VWAP False Breakout on BBBY.
Another perfect example can be seen in Figure 6.39, the trading behavior of Alcoa Corporation (ticker: AA) on January 18, 2018 when AA squeezed above VWAP two times: one at around 10:05 a.m. and the other at about 10:45 a.m. Both breakouts failed to break the 50 SMA on the 5-minute chart and bounced back below the VWAP, providing a short selling opportunity. The first VWAP False Breakout did not reach to the by then low of the day of $52.10 (which also was the low of the pre-market). The second VWAP False Breakout made an excellent short from VWAP to the new low of the day and below that.
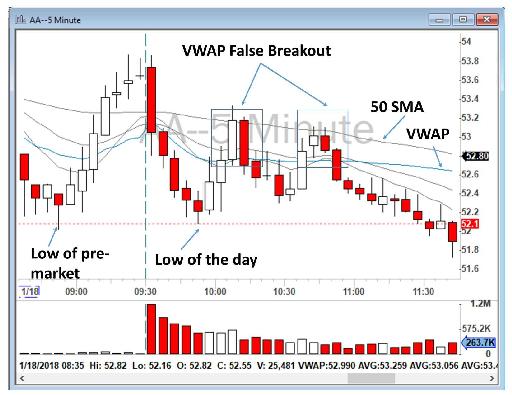
Figure 6.39 - Example of VWAP False Breakouts on AA.
To summarize my trading strategy for VWAP False Breakouts:
- Once I’ve made my watchlist for the day, I monitor the price action around VWAP at the Open and during the morning session for the Stocks in Play. A good Stock in Play shows respect toward VWAP.
- If the Stock in Play sells off below the VWAP but bounces back and breaks out above the VWAP, it means the buyers are gaining control and short sellers perhaps had to cover. However, if it loses the VWAP again in the Late-Morning (from 10:30 a.m. to 12 p.m.), it means that this time the buyers were mostly weak or exhausted. This provides a short opportunity with a stop loss above VWAP.
- The profit target can be the by then low of the day, or any other important technical level.
- I try to go short when a Stock in Play has lost the VWAP. Sometimes I go short before the price loses the VWAP, to get a good entry while it is ticking down toward VWAP in the anticipation of a VWAP loss. However, be very careful, for the job of a trader is identification and not anticipation. Take small size and add more shares on the way down if you have truly identified a good trading setup.
VWAP Reversals
Stocks in Play usually trade heavily at the Open and establish an Opening Range Breakout. They either move toward a new low of the day or stay strong above the VWAP and make a constant high of the day. However, they will also often reverse and test the VWAP. This strategy is called the VWAP Reversal and can be traded both on the long side and on the short side.
Let’s look at Figure 6.40, showing the trading behavior of JD.com, Inc. (ticker: JD) on November 13, 2017. JD opened strong, but suddenly sold off heavily at 9:35 a.m. with a big Bearish Engulfing Pattern. It did sell off heavily below the VWAP until 9:50 a.m. At 9:50 a.m., it failed to make a new 5-minute low and the trend changed. This is the time that a Stock in Play will often bounce back and test the VWAP, making it a great candidate for a VWAP Reversal trade. I took the trade to the long side at around $41.15 and rode the momentum toward and above the VWAP.
But why does a stock reverse back to the VWAP? In this case, many short sellers were still hoping that the stock would go lower, but if it doesn’t, all of those short sellers will need to cover fast, causing the price to squeeze back up really fast. We call this “squeezing the shorts”. If you have taken JD short at an Opening Range Breakout, you want to make sure to take proper profit and not let the trade go against you. This is because if you stay short while the 5-minute trend changes (such as failing to make a new 5-minute low, or establishing a higher highs and higher lows), then you may get squeezed.
What is the signal of a reversal? Usually, if a stock fails to make a new 5-minute low, that will be a sign of reversal. Or, even better, if the price starts to make higher highs and higher lows on a 5-minute chart, it means the sellers are exhausted and the price will bounce back toward VWAP.
Similar to all other trading strategies, there are also times that this strategy will not work. For example, the price might go against you and make a new low of the day. Therefore, it is important when trading this strategy, as it is for all strategies, that you define a proper stop loss. If you take the trade to the long side, you can define a stop loss just below the low of the day or the previous 5-minute candlestick low. For the profit target, the first target can be 9 or 20 EMA if there is any and, if not, you can cover VWAP. I always keep some of my position available for a squeeze above VWAP.
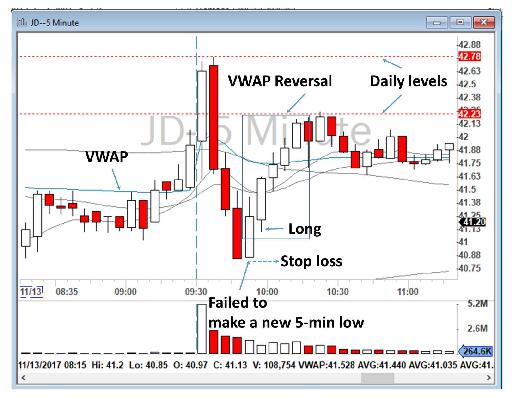
Figure 6.40 - Example of VWAP Reversal on JD.
Another example is a trade I took on Dollar Tree, Inc. (ticker: DLTR) on March 7, 2018. DLTR sold off heavily below the VWAP but stalled at around a resistance level of $88.10 and failed to make a new low. I took the trade long at $88.60, with the profit target of VWAP around $89.70, for a decent profit of $409 with 400 shares, as shown in Figure 6.41. In this case, looking at my 1-minute chart helped me to get a better entry after DLTR closed above 9 EMA on the 1-minute chart.
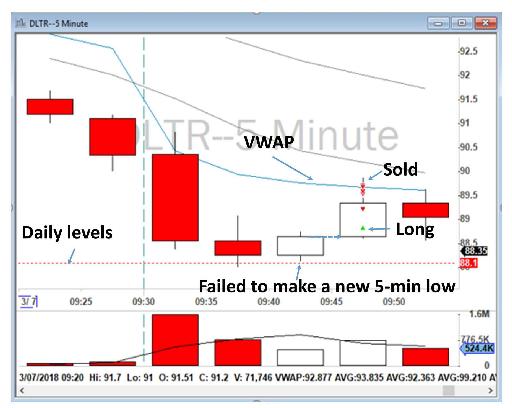
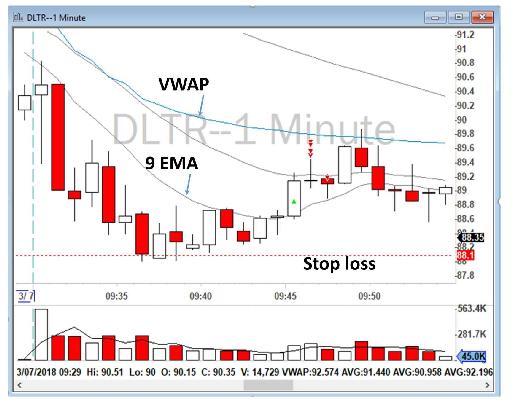
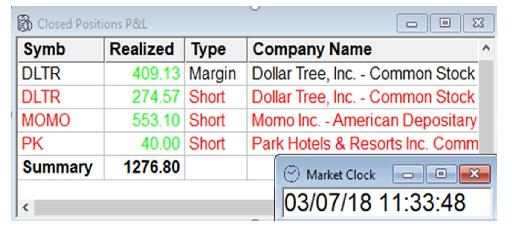
Figure 6.41 - Example of VWAP Reversal on DLTR.
Another example can be seen on Alcoa Corporation (ticker: AA) on January 18, 2018. AA sold off heavily below the VWAP, but stalled at around the $52.10 resistance level, and failed to make a new low. Interestingly, $52.10 was also the pre-market low. Not only did AA fail to make a new low, but its trend on my 5-minute chart reversed and became bullish, making higher highs and higher lows. A great entry could be found by looking at my 1-minute chart when the stock closed above 9 EMA on that 1-minute chart, with a stop loss below the low of the day and a profit target of VWAP around $52.80. A risk/reward ratio of around 2 could be expected, all as shown in Figure 6.42.
Getting an excellent entry and favorable risk/reward is extremely important in this strategy. Often, many Stocks in Play will reverse back to the VWAP, but these moves are not catchable, they happen so fast and so strong that you cannot really get a good entry with a proper risk/reward. Remember, you should not be in all of the moves, nor should you try to catch all of them. If a Stock in Play makes a great reversal but does not offer a good entry, it is better not to be in it. I often in the chatroom call some trends and moves correctly, but I will not take them myself. People wonder about that, and my response is always the same. Even if it is obvious what direction a stock will move in, if I cannot get a good entry, I will pass on it. And so should you.
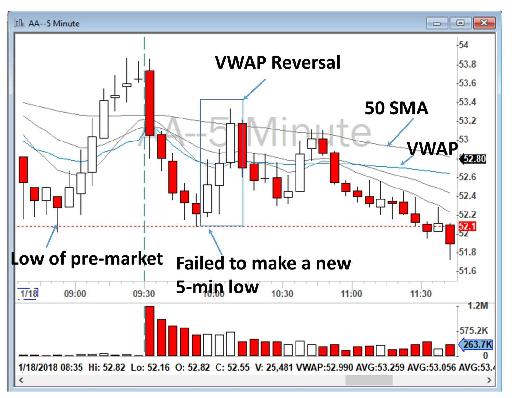
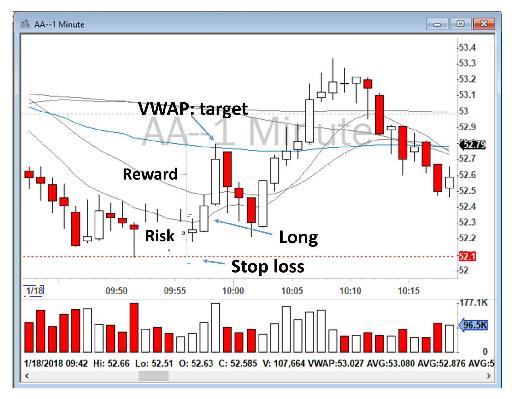
Figure 6.42 - AA VWAP Reversal on both 5-minute and 1-minute charts with risk/reward analysis on 1-minute chart.
Another example can be seen on Energous Corporation (ticker: WATT) on January 2, 2018, as set out in Figure 6.43. WATT sold off heavily below the VWAP at 9:30 a.m. but stalled and could not make a new 5-minute low between 9:35 and 9:40 a.m. Looking at my 1-minute chart, I saw that a good long entry around $21 was possible when a new 1-minute high was made for a move toward VWAP at around $22. WATT actually squeezed really hard above the VWAP toward $23.60. It is good to take some profit at the VWAP and let some of the position run above the VWAP as well. If there is an obvious level above the VWAP, such as the moving average of daily levels, it is safe to assume that the stock might test those levels as well.
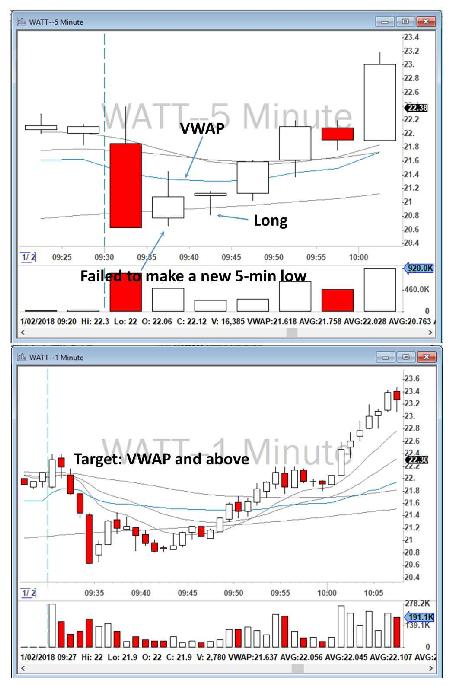
Figure 6.43 - Example of VWAP Reversal on WATT.
So far, my examples have been for stocks that made a reversal below the VWAP. A similar pattern can happen when the stock is above the VWAP at the Open but fails to make a new high of the day or a new 5-minute high. This provides a short selling opportunity toward the VWAP as shown in Figure 6.44 for the financial services and mobile payment company Square, Inc. (ticker: SQ). As you can see in Figure 6.44, SQ had a nice run at the Open toward $36.90 but failed to make a new high. This can provide a short selling opportunity toward VWAP.
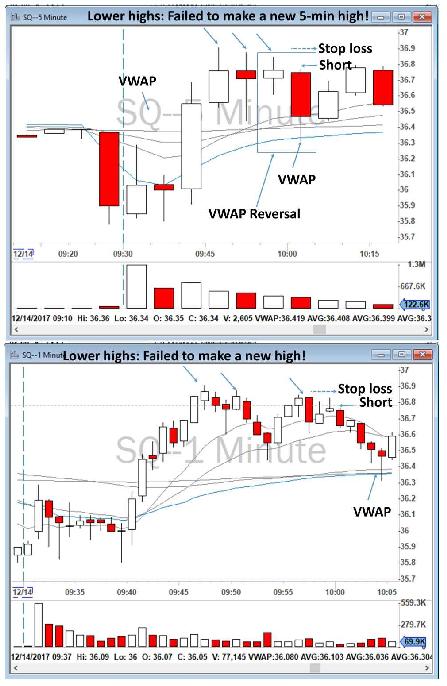
Figure 6.44 - Example of VWAP Reversal on SQ.
Another perfect illustration of this can be seen in the trading behavior of Signet Jewelers Limited, the world's largest retailer of diamond jewelry (ticker: SIG), as set out in Figure 6.45. The stock made a strong move at the Open toward $57.80 but failed to hold those highs and started to make lower lows on my 5-minute chart. This signaled to me a great short selling opportunity. I went short at $57.10 with a stop loss above the high of the day with the profit target of VWAP and below. SIG sold off toward the high of the day. The first target could have been to cover my short at the VWAP.
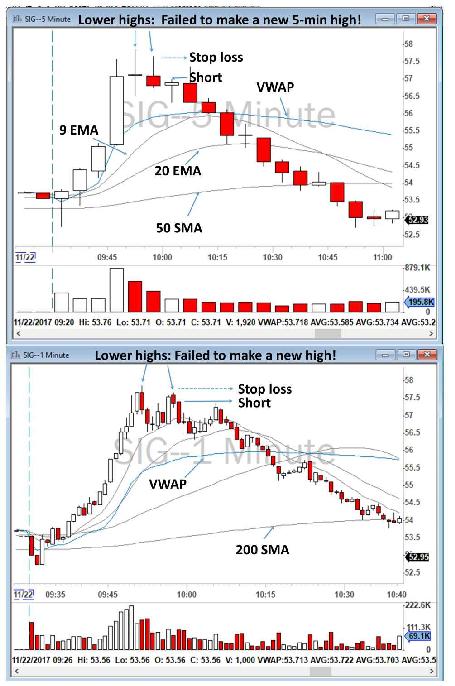
Figure 6.45 - Example of VWAP Reversal on SIG.
The second target could have been 20 EMA on my 5-minute chart and later 50 SMA on the 5-minute chart. That is why I encourage traders to cover the first part of their position at the VWAP, bring the stop loss to break-even and then wait for the next move. As you can see in this example, SIG actually sold off from $57 to below $54, at around 200 SMA, on my 1-minute chart.
To illustrate the importance of having several profit targets, let’s take a look at Figure 6.46, a trade I managed badly on the American food and beverage company, and the largest dairy company in the United States, Dean Foods Company (ticker: DF). DF opened weak and sold off below the VWAP, but failed to make a new 5-minute low for a 5-minute Opening Range Breakout. I decided to go long at $8.40 and added more at $8.45 for the pop above the VWAP. I got cold feet and sold too early for a very small profit, but as you can see, DF squeezed above the VWAP and hit 9 EMA and 20 EMA. I did not trade it well, but a great trade would have been:
- Long at $8.45 with the signal of a failure to make a new low on my 5-minute chart
- Stop loss below the low of the day
- First target: VWAP at around $8.55
- Second target: 9 EMA on my 5-minute chart
- Third target: 20 EMA on my 5-minute chart
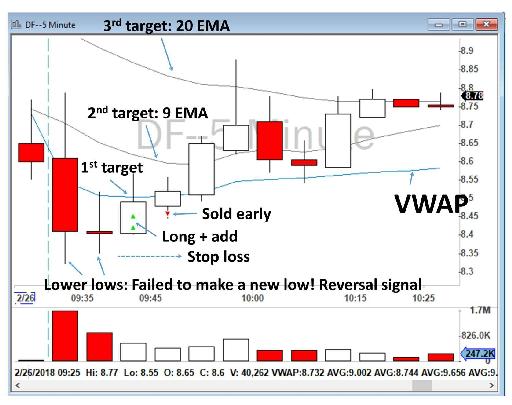
Figure 6.46 – Example of DF VWAP Reversal with several profit targets.
I unfortunately could not execute this trade well and missed the move. As I mentioned above, when I went long, I sold my position too early because I simply got cold feet and did not stick to my initial trading plan.
Another illustration of a VWAP Reversal with several profit targets can be seen in the May 11, 2018 trading behavior of the American software company Symantec Corporation (ticker: SYMC), as set out in Figure 6.47. The stock sold off at the Open toward $18.75 but failed to make a new low on my 5-minute chart. This signaled to me a great long opportunity. I went long at $19.21 with a stop loss below the low of the previous 5-minute candlestick at around $19 with the first profit target of VWAP. The other profit targets were 20 EMA on my 1-minute chart and also 20 EMA on my 5-minute chart. I sold my long position on the way up. Although SYMC did break above 20 EMA on the 1-minute chart, it never reached 20 EMA on the 5-minute chart. I sold the last part of my long position when the stock sold off back toward VWAP for a total profit of $1,539, all as shown in Figure 6.47.
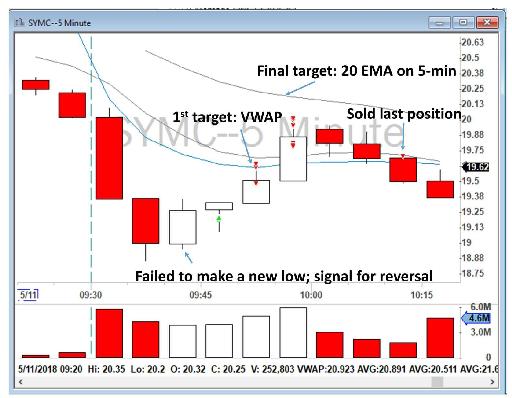
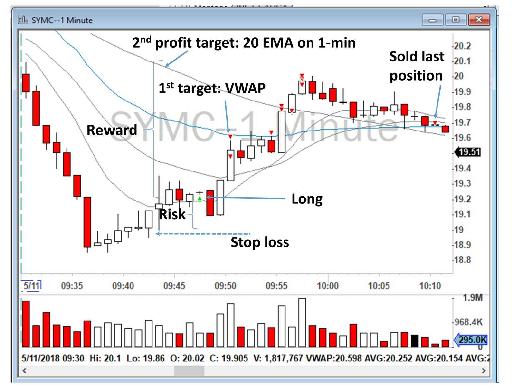
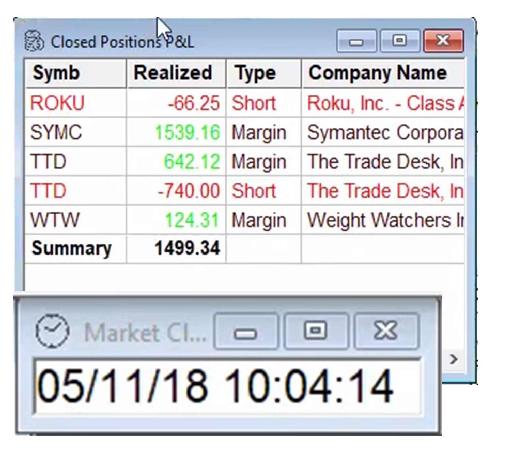
Figure 6.47 – Example of SYMC VWAP Reversal with several profit targets.
Another VWAP Reversal example can be seen in my trading of VIP.com, the Chinese e-commerce discount sales company Vipshop Holdings Limited (ticker: VIPS), as set out in Figure 6.48. I made two trades on it on May 15, 2018.
In the first trade, the stock sold off heavily at the Open toward $11.80 but failed to make a new low on a 5-minute chart. This signaled to me a great long opportunity. I went long at $12.10 with a stop loss below the low of the previous 5-minute candlestick at around $11.95 with the first profit target of VWAP. I sold some at the VWAP and waited to see if VIPS would squeeze above the VWAP toward 9 and 20 EMA on my 5-minute chart. It did make a new 5-minute low and I got out the last of my position at break-even. But that turned out to be only a whipsaw, and I went back long again above VWAP at $12.21 with a profit target of 200 SMA on my 1-minute chart and I sold toward the target for a nice profit. The total profit of those two trades was $1,249, as also shown in Figure 6.48. As a side note, just in case you have not previously come across the term in relationship to day trading, whipsaw describes what happens when the price of a stock is moving in one direction and then quickly reverses and heads in the other direction.
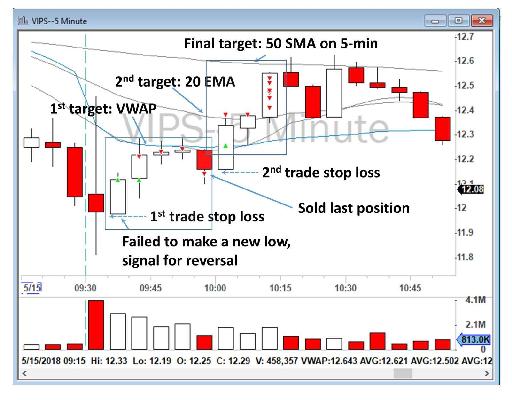
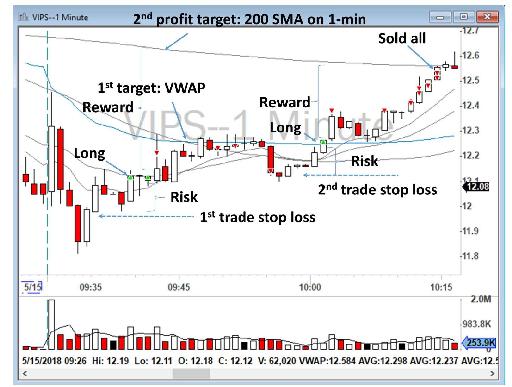
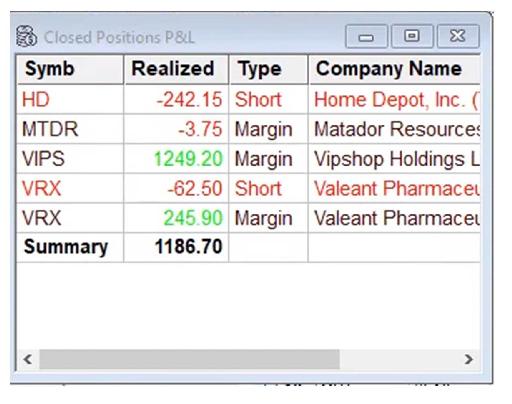
Figure 6.48 – Example of VIPS VWAP Reversal with several profit targets.
To summarize the VWAP Reversal Strategy:
- After I build my watchlist in the morning, I closely monitor the shortlisted stocks in the first five minutes after the Open. I identify their opening range and their price action. The stocks will either move higher or below the VWAP. Depending on the price action, I may be able to take an Opening Range Breakout to the long or short side.
- I monitor the price when it moves away from the VWAP and look for a sign of weakness. If it is above the VWAP, failing to make a new high of the day may be a sign that the buyers are exhausted. If it is below the VWAP, failing to make a new low of the day or a new 5-minute low can be a sign that the sellers are gone, and the stock can be ready for a squeeze back to the VWAP.
- I take the trade only if I can get a good entry and a good risk/reward ratio. Remember, most of the time stocks move really fast without offering a good entry and a good risk/reward ratio.
- If I am short above the VWAP, I cover my short at the VWAP and bring my stop loss to break-even. If I am long below the VWAP, I sell part of my position at the VWAP, and keep the rest for a squeeze above the VWAP (or as some traders would call it, a VWAP Pop). Do ensure you bring your stop loss to break-even, because sometimes the stock can bounce back from the VWAP as well.
I will emphasize again: for every trade you need to find a good entry with a favorable risk/reward ratio. You won’t always find one. To illustrate this point, let’s review a trading session for Deere & Company, AKA John Deere, the famous manufacturer of agricultural, construction, and forestry machinery (ticker: DE), as set out in Figure 6.49. DE sold off heavily at the Open from the VWAP to $142.25 at 9:50 a.m. At 9:55 a.m., it failed to make a new low and bounced back toward the VWAP. However, I had to wait from between 9:50 a.m. to 9:55 a.m. for the candlestick to close to ensure that it would not make a new low. You cannot assume that a candlestick will not make a new low until it closes. But in this instance, when it closed, it had formed a bullish engulfing candlestick. Although it was bullish, the next candlestick between 9:55 a.m. and 10 a.m. was so far from the low of the day and so close to the VWAP that the risk/reward ratio was no longer worth it. If the 9:55 a.m. to 10 a.m. candlestick had come lower, closer to the low of the day, then I could have gone long with a better risk/reward ratio. I waited, but I never got a good entry. I did not take the trade.
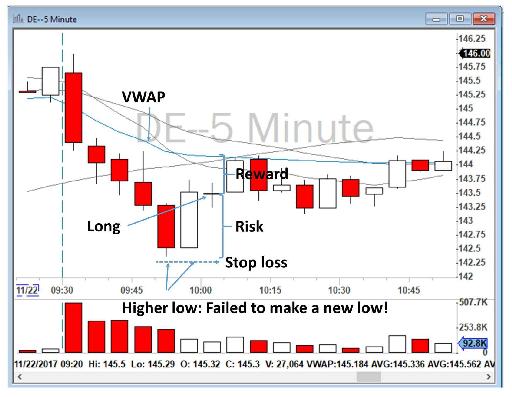
Figure 6.49 – Risk/reward reversal analysis on DE.
VWAP Moving Average Trend
Bull Flags, the ABCD Pattern and Opening Range Breakouts happen at the Open. VWAP Reversals happen later in the Open and in the Late-Morning, and VWAP False Breakouts mostly occur in the Late-Morning session and into the early afternoon. But what happens to Stocks in Play during the rest of the trading day following the morning session? The answer is that often Stocks in Play will find a trend and stay above the VWAP and move higher, or they will stay below it and move lower, using moving averages as their guide.
Different traders and educators have different names for this strategy: Trend Trading, Moving Average Trend Trade, Trend Continuation Pattern, Trade2Hold, All Day Fade and so on. They are essentially the same strategy.
Although some Stocks in Play stay choppy around the VWAP for the entire day, most of the Stocks in Play often move during the day after “losing” or “holding” VWAP, and these moves are catchable by looking at 1-minute and 5-minute 9 EMA and 20 EMA during the Late-Morning session (around 11 a.m. New York time). Some traders use these moving averages as potential entry and exit points for day trading as they see their moving averages on 1-minute and 5-minute charts as a type of moving support and resistance line. Traders can benefit from this behavior and ride the trend along the moving average (on top of the moving average for going long or below the moving average for short selling).
As I explained in Chapter 2 about my indicators, I use 9 and 20 Exponential Moving Averages (EMA) and 50 and 200 Simple Moving Averages (SMA). Your charting software or trading platform will have most of the moving averages built into it. They are ready to be used and there is no need to change the default setting in them.
Let’s take a look at the chart below for AAOI on April 19, 2017, marked as Figure 6.50, to see how you could trade based on moving averages and a loss of VWAP on a 5-minute chart.
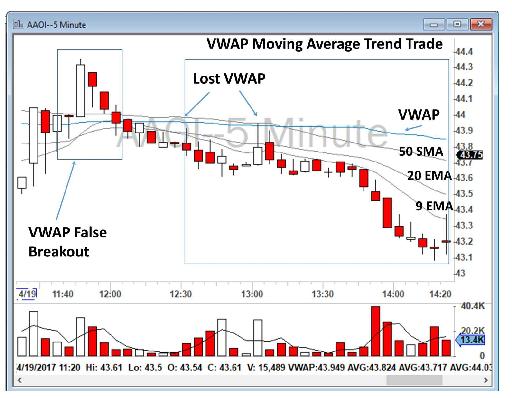
Figure 6.50 - Example of a short VWAP Moving Average Trend Strategy on AAOI on a 5-minute chart.
As you can see, in the Late-Morning, just before noon, there was a VWAP False Breakout. Later, around 12:30 p.m., AAOI tried to push back above the VWAP but both times “failed”, and then lost the VWAP around 1 p.m. AAOI had no place to go except lower. A nice trade was established at around 1 p.m. by going short below VWAP and putting a stop loss above the break of the moving averages. VWAP Moving Average Trends can happen in any intraday time frame. As a general rule, I monitor the prices on both my 1-minute and 5-minute charts and make my trades based only on those two time frames.
Let’s take a look now at Figure 6.51, which is another VWAP Moving Average Trend Strategy, but this time on Facebook, Inc. (ticker: FB) on a 5-minute chart on March 21, 2018. Facebook became a Stock in Play after March 20, 2018 because of the shocking news that Cambridge Analytica, a data analytics firm that worked with many political campaigns, had extracted Facebook data from well over 50 million user accounts, with Facebook’s knowledge, and then for several years used that data for political campaigns. Wall Street reacted to this news and the company lost $50 billion in market value in the first two trading days after the news broke out. Mark Zuckerberg, the CEO of Facebook, acknowledged there was “a breach of trust between Facebook and the people who share their data with us”.
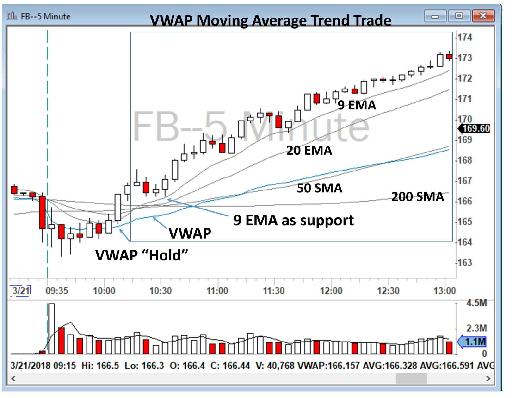
Figure 6.51 - Example of a short VWAP Moving Average Trend Strategy on FB on a 5-minute chart.
The same pattern can be seen on the 1-minute chart for FB as shown in Figure 6.52. As you can see, the stock held at both 9 EMA and 20 EMA as support. I often put more emphasis on 20 EMA than 9 EMA. I marked moving averages on the chart, but they are easy to recognize. The smaller the moving average, the more frequently it will touch the price. The closest moving average on a chart is 9 EMA, as it “hugs” the price more frequently. You will often notice that a price will break 9 EMA but then will bounce back on 20 EMA.
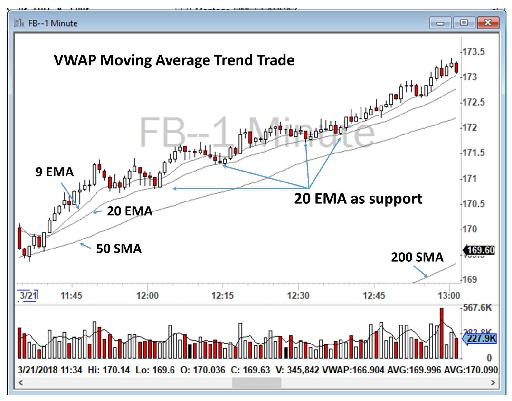
Figure 6.52 - Example of a short VWAP Moving Average Trend Strategy on FB on a 1-minute chart.
Another example can be seen on Nordstrom, Inc. (ticker: JWN). As you can see in Figure 6.53, at around 11:30 a.m., JWN lost the VWAP and started going lower. It did break 9 EMA on a 5-minute chart in a few places, but it never lost the 20 EMA, and it moved down from $42.20 to close at $41. This example is interesting because you can also see many of the earlier strategies I’ve discussed. It had a nice Opening Range Breakout below VWAP, followed by a reversal back to VWAP, and then it went above VWAP. It later lost the VWAP and formed a VWAP False Breakout. And still later, it “lost” VWAP for the entire afternoon.
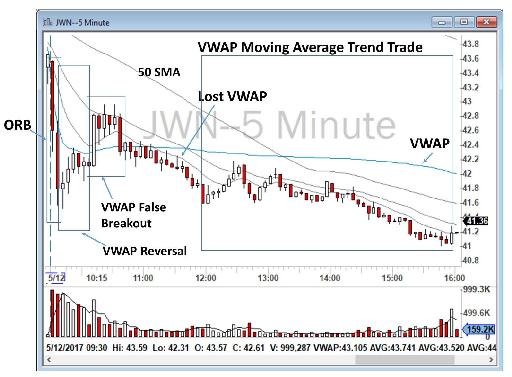
Figure 6.53 - Example of a VWAP Moving Average Trend Strategy on JWN.
Another fantastic example is shown in Figure 6.54 below, a 9 EMA and 20 EMA VWAP Moving Average Trend trade on a 5-minute chart for TGT on May 17, 2017. On that day, TGT sold off of a VWAP False Breakout at $56.38 to fall toward $55 at the Close. The 9 EMA held as a strong resistance. A great trade would have been a short sell on TGT with a stop loss of the break of 9 or 20 EMA. As you can see, the price did push above 20 EMA in some places but no candlestick really closed above 9 or 20 EMA. Experienced traders wait for a 5-minute candlestick to “close” above 20 EMA before they get out. A sudden break of 9 or 20 EMA with low volume may not be a good indicator of a trend coming to an end. I have found that 20 EMA is a more powerful resistance than 9 EMA for these type of trend plays.
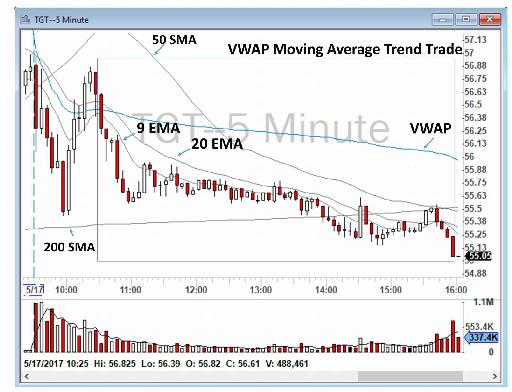
Figure 6.54 - Example of a VWAP Moving Average Trend Strategy on TGT.
Another example can be seen for The Trade Desk, Inc. (ticker: TTD) on May 12, 2017 after the release of a great earnings report, as set out in Figure 6.55. TTD squeezed above the VWAP in the morning session and then stayed above the VWAP and 9 EMA, providing for an excellent VWAP Moving Average Trend trade during the day, as its price moved from $47 to $53.
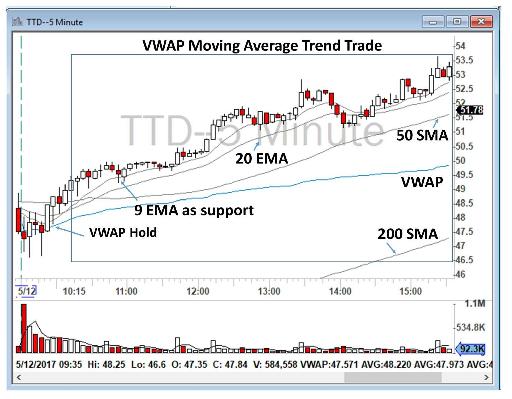
Figure 6.55 - Example of a VWAP Moving Average Trend Strategy on TTD.
Another example can be seen in Figure 6.56 for GoPro, Inc. (ticker: GPRO) on September 21, 2017 after a disappointing earnings report. GPRO lost the VWAP in the morning session at around 10:30 a.m., and in the Late-Morning it tried to break above the VWAP but could not. At around 12:30 p.m. it was obvious that buyers were exhausted (otherwise it would have been squeezed above the VWAP by then). When GPRO failed to break above 9 and 20 EMA, you could have gone short with a stop loss above the VWAP or the break of 20 EMA. GPRO lost value all of that day, going from $11.25 at the VWAP to $10.94 later in the afternoon.
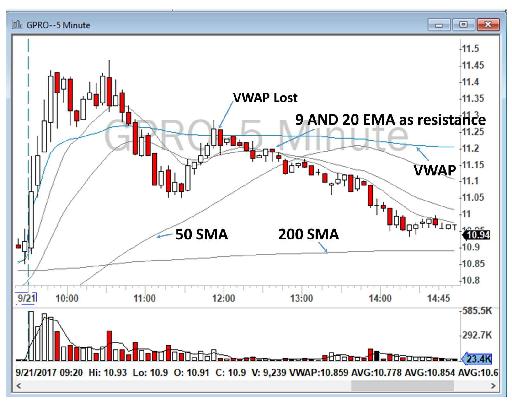
Figure 6.56 - Example of a VWAP Moving Average Trend Strategy on GPRO.
To summarize my trading strategy for VWAP Moving Average Trend trading:
- When I am monitoring a Stock in Play and notice a trend is establishing around a moving average (usually 9 EMA) in the Late-Morning session, I consider VWAP Moving Average Trend trading. If the stock has already lost the VWAP (from a VWAP False Breakout), it most likely will stay below the VWAP. Similarly, if the stock squeezed above the VWAP in the Late-Morning session, it is most likely that it will stay above the VWAP, as it means the buyers are in control.
- Once I learn that either 9 or 20 EMA are acting as either a support or resistance, I buy the stock after confirmation of moving averages as a support, but only if I can clearly see it “held” the VWAP. Similarly, I go short below the moving averages if I have the confirmation that it has “lost” the VWAP in the Late-Morning session.
- I buy or sell short as close as possible to the moving average line (in order to have a small stop). My stop will usually be 5 to 10 cents below the moving average line or, if a candlestick, close below the moving average (for long positions). For short positions, a close above the moving average would stop me out.
- I ride the trend until the break of 9 or 20 EMA. Usually, 20 EMA is a stronger support or resistance, so it is better to wait for that.
- I usually do not use trailing stops and I constantly monitor the trend with my eyes, but I know that many traders also use trailing stops.
- If the stock is moving really high away from the moving average, offering me an equally really nice unrealized profit, I may take some profit, usually at the 1/4 or half-position. I do not always wait until the break of moving average for my exit. Traders will say: you can never go broke by taking good profits. If the price pulls back to the moving average, I may add again to my position and continue the VWAP Moving Average Trend trade.
- Remember, when you take profit, you should always bring your stop loss to break-even. Never go red on a stock that you already booked some profit on.
I usually do not trade the VWAP Moving Average Trend Strategy, primarily because most of the time I am not trading in the afternoon. Often VWAP Moving Average Trend trades can last as long as several hours and that is too long for my personality. I prefer to take my profit in a matter of minutes. I rarely will wait even an hour. Another reason that I do not often trade these strategies is that they usually best work during Mid-day and the Close. At the Open (in the morning session), when volatility is high, it’s hard to identify a VWAP Moving Average Trend play, and you should not try to trade that. These slow trends are best identified during the Late-Morning and Mid-day, when there is low volatility, and they usually end near the Close (around 3 p.m. New York time), when the professional traders on Wall Street start to dominate the trading.
Having said that, a VWAP Moving Average Trend Strategy is an excellent trading strategy, because it usually does not require a very fast decision-making process and trade execution. It also often does not require the use of Hotkeys. You can enter the trades manually and still be successful. In addition, entry points and your stop loss can be clearly recognized from the moving averages on the charts. This is especially important for traders who pay high retail commissions (sometimes as high as $4.95/trade) and cannot scale in and out of trades without a high fee. The VWAP Moving Average Trend Strategy has clear entry and exit points, and usually a good profit can be made by only two orders, one for the entry and one for the exit.
As I have discussed, strategies depend on your account size, personality, psychology of trading and risk tolerance, as well as on your software and the tools and brokers that you have. The combination of all of these factors will help to define the type of trader that you are and the specific strategy (or strategies) that will serve you best. I want to emphasize that trading strategies are not something that you can imitate just from reading a book, speaking with a mentor, or attending a class. You have to slowly and methodically develop your preferred method and then stick with it. There is nothing wrong with any strategy if it works for you. There is no good and bad in any of these strategies; it truly is a matter of personal choice.
Table of contents
- DISCLAIMER:
- Table of Contents
- Chapter 1: Introduction
- Chapter 2: The Trading Tools and Platform
- Chapter 3: Building Your Trading Watchlist
- Chapter 4: Support and Resistance Levels
- Chapter 5: Price Action, Candlesticks and Trade Management
- Chapter 6: Advanced Day Trading Strategies
- Chapter 7: Risk and Account Management
- Chapter 8: Conclusion and Final Words
- Glossary