Strategy 4: Opening Range Breakout
Another well-known trading strategy is the so-called Opening Range Breakout (ORB). This strategy signals an entry point, but does not determine the profit target. You should define the best profit target based on the other technical levels you learn from this book. Later on, you will notice that I list further possible profit targets. The ORB is an entry signal only, but remember, a full trading strategy must define the proper entry, exit and stop loss.
Right at the market Open (9:30 a.m. New York time), Stocks in Play usually experience violent price action that arises from heavy buy and sell orders that come into the market. This heavy trading in the first five minutes is the result of the profit or loss taking of the overnight position holders as well as new investors and traders. If a stock has gapped up, some overnight traders start selling their position for a profit. At the same time, some new investors might jump in to buy the stock before the price goes higher. If a stock gaps down, on the other hand, some investors might panic and dump their shares right at the Open before it drops any lower. On the other side, some institutions might think this drop could be a good buying opportunity and they will start buying large positions at a discounted price.
Therefore, there is a complicated mass psychology unfolding at the Open for the Stocks in Play. Wise traders sit on their hands and watch for the opening ranges to develop and allow the other traders to fight against each other until one side wins.
Typically, you want to give the opening range at least five minutes. This is called the 5-minute ORB. Some traders will wait even longer, such as 30 minutes or even one hour, to identify the balance of the power between the buyers and sellers. They then develop a trade plan in the direction of the 30-minute or 60-minute breakout. In the past, I only traded the trade at the 5-minute ORB, but recently I am more in favor of the 15-minute ORB or the 30-minute ORB. The longer the time frame, the less volatility you can expect, compared to the 5-minute range. As with most setups, the ORB Strategy tends to work best with mid to large cap stocks, which do not show wild price swings intraday. I do not recommend trading this strategy with low float stocks that have gapped up or down. Ideally, the stock should trade within a range which is smaller than the Average True Range of the stock (ATR). The upper and lower boundaries of the range can be identified by the high and low of the 5-, 15-, 30- or 60- minute candlesticks.
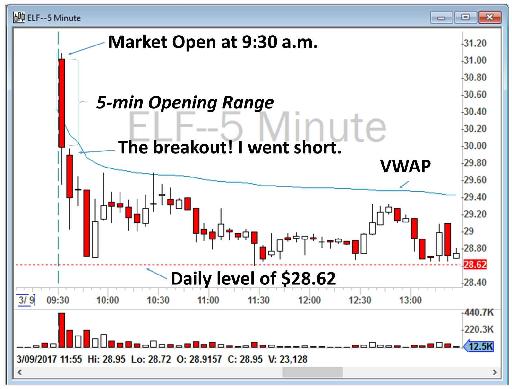
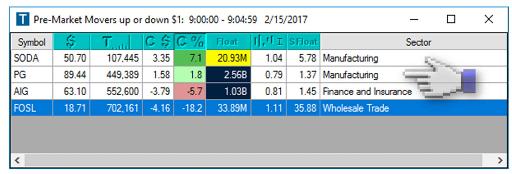
To gain a better understanding of this strategy, let’s take a look at Figures 6.28 and 6.29 for e.l.f. Beauty, Inc. (ticker: ELF) on March 9, 2017. ELF was on my Gappers watchlist that day, and had gapped up over 19% for good results. I decided to watch it closely to see if I could trade it on the short side. There was a good chance that many overnight investors and traders would try to sell their positions for profit. An overnight profit of 19% is very tempting for many investors. Why not take the profit?

Figure 6.28 - My Gappers watchlist on March 9, 2017 at 9 a.m. showing ELF may be a Stock in Play for that day.
As you can see in Figure 6.29 below, the stock opened at $31 and sold off heavily to below $30 in the first five minutes. That was the sign that investors were selling for profit after it had gapped up 19%. I waited for the first 5-minute battle of buyers and sellers to settle down. As soon as I saw that the price broke the 5-minute opening range, I went short below VWAP. As I mentioned before, ORB is a buy or sell signal, and you must define the proper exit and stop loss for it. For me, stop loss is always a close above VWAP for short positions, and a break below VWAP for long positions. The profit target point is the next important technical level.
As you can also see in Figure 6.29 below, I rode the wave down to the next daily level of $28.62 and covered my shorts at around that level.

Figure 6.29 - Example of the ORB Strategy on ELF 5-minute chart.
Another example could be Procter & Gamble Co. (ticker: PG) on February 15, 2017. The stock hit my Gappers Scanner, see Figure 6.30, and I had it on my watchlist at the Open.

Figure 6.30 - My Gappers watchlist on February 15, 2017 at 9 a.m. showing PG may be a Stock in Play for that day.
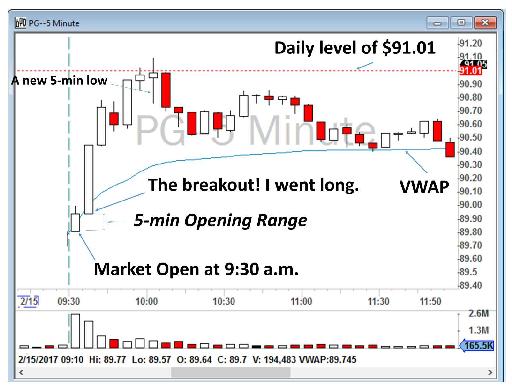
As you can see below in Figure 6.31, more than 2.6 million shares were traded in only the first five minutes of trading, but PG’s price only moved from $89.89 to $89.94, a range of only 5 cents, while the Average True Range (ATR) of PG was $0.79. As I have mentioned, you need the opening range to be smaller than the daily ATR. If a stock moves near or higher than its ATR at the Open, it is not a good candidate for the ORB Strategy. It means that the stock is too volatile and without a catchable move. It is worth mentioning again that Stocks in Play move, and those moves are directional and catchable. If a stock constantly moves up and down $2 with high volume, but without any directional signal, you want to stay away from it. Those stocks are usually being heavily traded by computers.
In the PG example, as soon as I saw that it broke the opening range to the upside, I went long and rode the wave up toward the next resistance level of $91.01. If there was no obvious technical level for the exit and profit target, you can exit when a stock shows signs of weakness. For example, if its price makes a new 5-minute low, that means weakness, and you should consider selling if you are long. If you are short and if the stock makes a new 5-minute high, then it could be a sign of strength and you may want to cover your short position. In this PG example, if you did not previously identify the $91.01 level, you could exit when PG made a new 5-minute low just below $91. I marked it for you in Figure 6.31 below.

Figure 6.31 - Example of the ORB Strategy on PG 5-minute chart.
To summarize my ORB Strategy:
- After I build my watchlist in the morning, I closely monitor the shortlisted stocks in the first five minutes after the Open. I identify their opening range and their price action. How many shares are being traded? Is the stock jumping up and down or does it have a directional upward or downward movement? Is it high volume with large orders only, or are there many orders going through? I prefer stocks that have high volume, but also with numerous different orders being traded. If the stock has traded 1 million shares, but those shares were only ten orders of 100,000 shares each, it is not a liquid stock to trade. Volume alone does not show the liquidity; the number of orders being sent to the exchange is as important.
- The opening range must be significantly smaller than the stock’s Average True Range (ATR). I have ATR as a column in my Trade Ideas scanner.
- After the close of the first five minutes of trading, the stock may continue to be traded in that opening range in the next five minutes. But, if I see the stock is breaking the opening range, I enter the trade according to the direction of the breakout: long for an upward breakout and short for a downward move.
- My stop loss is a close below VWAP for the long positions and a break above VWAP for the short positions.
- My profit target is the next important technical level, such as: (1) important intraday daily levels that I identify in the pre-market, (2) moving averages on a daily chart, and/or (3) previous day close.
- If there was no obvious technical level for the exit and profit target, I exit when a stock shows signs of weakness (if I am long) or strength (if I am short). For example, if the price makes a new 5-minute low, that means weakness, and I consider selling my position if I am long. If I am short and the stock makes a new 5-minute high, then it could be a sign of strength and I consider covering my short position.
My strategy above was for a 5-minute ORB, but the same process will also work well for 15-minute or 30-minute ORBs.
Table of contents
- DISCLAIMER:
- Table of Contents
- Chapter 1: Introduction
- Chapter 2: The Trading Tools and Platform
- Chapter 3: Building Your Trading Watchlist
- Chapter 4: Support and Resistance Levels
- Chapter 5: Price Action, Candlesticks and Trade Management
- Chapter 6: Advanced Day Trading Strategies
- Chapter 7: Risk and Account Management
- Chapter 8: Conclusion and Final Words
- Glossary