Trade Management Based on Price Action
Two traders enter into a trade based on one strategy. The trade goes their way and then pulls back a bit. The first trader fears losing their gain and takes a quick, small profit. The second trader adds to the position on the pull back and books a much larger gain. Same idea, different outcomes, all as the result of two different mindsets and trade management styles.
Successful trade management is the key to success in a trade and is just as important as the quality of your initial trade plan. By trade management, I mean something different from finding the Stocks in Play and then executing a strategy. Rather, trade management refers to what you do with your position after you enter it and before you exit it.
The proper management of trades makes all of the difference between consistently profitable traders and those who eventually fail. Novice traders believe that when they enter the trade, they should not do anything else but patiently wait for the price to hit their profit target or stop loss level. This is the opposite of what professional traders do. The professionals know that this is not enough. When you plan for the trade and enter a position, you have a minimum of information about the market and the validity of your idea. As the market moves after your entry, you will receive new price action and data about your initial trade idea: the price action of the stock is either supporting or not supporting your reasons for being in that trade. Therefore, you need to manage your open position.
Trade management means that you have to be actively engaged in processing information while the trade is on, not just watching your position or moving away from your computer and hoping that your profit target order hits. For example, if you are expecting a break from a strong support level to the downside, and you want to profit the move to the downside with a short position, you may want to start with shorting 100 shares. When the stock makes a new low from that level, the scalpers and algorithms will usually start scalping when the level breaks to the downside with a profit of 5 to 10 cents. When those scalpers take their profit, the price often pulls back to that support level to test it as a new resistance level. If it is held below the support level (now acting as a resistance level), you can start adding to your short position on the way down. If it does not act as a resistance level and the price moves back up, you will get stopped out for a small loss because you had only shorted 100 shares.
Unfortunately, trade management is the most important element of learning how to be a consistently profitable trader and, at the same time, it is very difficult to teach to new traders, especially in a book. Trade management requires experience and real time decision making. That is why I strongly encourage you to join a community of traders, watch for a few weeks how experienced traders trade, and hear their thought process on managing their open trades. I know this sounds like an advertisement for chatrooms and communities, but in all honesty, there is considerable value in observing the thought process of experienced traders, if they are willing to share it with others, no matter if it is in real time chatrooms or elsewhere.
It always intrigues me in our chatroom when two experienced traders select the same stock: one long and the other short. Often, by the end of the day, both are profitable, proving that experience in trade and risk management and proper position sizing are more important than the stock and the direction that traders pick. Often my friend Brian Pez and I will trade against each other, but we will both be profitable when we finish our day. And how does that happen? It’s based on practice, discipline and controlling our emotions in the heat of the trade, even though I do like to think that I’m a better trader than him!
One of the most important trading rules is to take partial profit when a trade goes in your direction. You should take 1/2 or 1/4 of your position as profit and let the remaining position continue to move in your direction. For me, when a trade goes in my favor, I will take 1/4 of my position at the next potential profit target. I defined a Hotkey that automatically exits 1/4 of my remaining position. For example, when I am short 800 shares of a stock, the first press of that Hotkey is to cover 200 shares. The next press will be to cover 1/4 of the remaining 600 shares (150 shares), which my platform automatically calculates and sends to the market. I do not need to do this calculation in my head and type it in every time.
Before providing some examples, let me explain two important fundamentals of successful trade management:
- Never let a winning trade turn into a loss
- Move your stop loss in the direction of your trade
When you enter into a trade, you must define a protective stop loss against your entry. The price (hopefully) will move in your direction and you will then have an “unrealized” profit. Never let that open trade that shows a decent unrealized profit turn into a loss! Never! Before you enter into a trade, start planning at what level you will begin to protect your profits. For example, if your profit target for a trade is about $1,000, you may decide that a profit of $250 needs to be protected. Once your open profit rises to $250, you can close a portion of your position and move your stop loss to the break-even. I usually close at the 1/4 point and move my stop loss to break-even. Soon after moving your stop loss to break-even, you will be in the driver’s seat of the trade. You will have nothing to lose and you will now be trading with the house money.
After you booked that first profit of $250, you should decide what percentage of the open profit you’ll protect. For example, you may decide that once the break-even stop loss is in place, you’ll book another 1/4 of your unrealized profit in another level. These levels aren’t set in stone. You may choose different percentages depending on your level of confidence in a trade and your risk tolerance. As the trade moves in your favor, your remaining unrealized P&L will shrink.
Now imagine you go long on a stock and put a stop below your entry. That price rises but pulls back in a way that results in your unrealized P&L going negative, inching toward your stop loss. What will you do next?
First of all, as I discussed above, you should learn from your mistake of not having moved up your stop. That stop should have already been raised to break-even. You now have limited options: either take a small loss right away or continue to hold. However, many traders often choose an utterly unplanned choice: to lower the stop loss, giving that one losing trade a little bit “more room”. Only this time, they say. Don’t do it! The logical thing to do when a trade starts acting badly is to accept a small loss and continue to evaluate the chart and be ready to trade it again if another opportunity reveals itself. Breaking risk management rules by doing a marginal cost analysis of “just this once” usually results in an unending stream of extenuating circumstances.
The marginal cost of breaking a rule “just this once” always seems to be negligible, but in trading, the full cost of it will often be much higher and too many “just this once” will almost always result in significant financial loss and the ending of one’s trading career. Yet unconsciously, many traders employ the marginal cost doctrine in their trading and for their losing trades. A voice in the trader’s head says, “Look, I know that as a general rule, I shouldn't do this. But in this particular trade, just this once, let’s give it more room.” And the voice in their head seems to be right; the price of doing something wrong “just this once” usually appears seductively low. However, it suckers you in, and you don't see where that path is ultimately headed or the full cost that the choice entails.
When I wanted to lose some weight, my personal trainer provided me with an excellent, easy-to-follow diet. He mainly cut sugar, white flour, and simple carbohydrates from my diet and replaced them with healthy fats, protein and complex carbohydrates such as oatmeal and yams. It was a perfect diet. He also allowed me to have one “cheat meal” per week, on the day that I trained and ran the most. In the cheat meal, I was allowed to have whatever I wanted, even ice cream.
As much as I knew that this diet was beneficial to me, I could never follow it and stick to it. Every time I had that cheat meal, I was back into my old habits of craving sugar. It was basically an eating disorder, perhaps even a psychological disorder. Like an alcoholic on a rehab program, it takes only one sip to get back into the bad habits. More people in the world are addicted to food than to anything else. Sugar, oil and salt are the three most addictive chemicals humans have ever tried. Is it any wonder why potato chips and French fries are among the unhealthiest foods on the planet but millions of people are eating them every day. They are a drug on top of a drug on top of a drug: sugar covered with oil covered with salt.
I was wondering why I could not follow my diet, until I decided to remove the cheat meal from the diet plan. As soon as I did, I was able to follow the diet perfectly, and I shed the few extra pounds I was trying to lose before the summer. And here's the lesson I learned: it's easier to hold true to any principle 100 percent of the time than it is to hold true to it 98 percent of the time. The boundary is powerful because you just don't cross it; if you have justified crossing it once, there's nothing to stop you from doing so again and again. Similarly, in trading, giving a trade more room “just this once” is an act of desperation arising from wishful thinking. Professional traders will accept a small loss and stay alert for another trade. They often take several quick stabs at a trade before it starts running in their favor and toward a large profit.
To illustrate these points, let’s review some real trades that I took. Figure 5.9 shows my trade management while I was trading ADBE on June 21, 2017. I went short at 9:40 a.m. in two stages with the average price of $145.25, and with a profit target in mind at the $144.25 level and the 50 SMA on my 5-minute chart. My original stop loss was above VWAP at around $145.70.
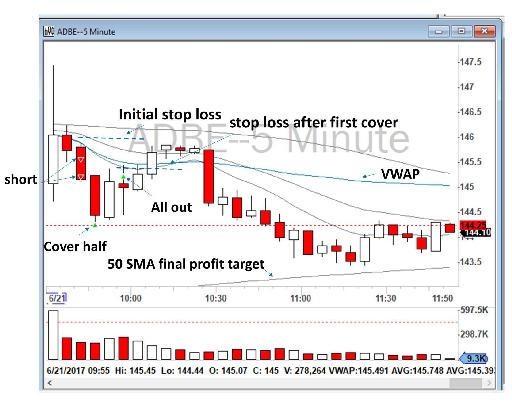
Figure 5.9 - Example of stop loss management in a trade on ADBE.
The price sold off quickly and I covered half of my position at my first target of $144.25. As soon as I covered my half-position, I decided to bring my stop loss to break-even. I would not allow this stock to go against me anymore! Now, my new stop loss was at around my entry average price of $145.25. As you can see, the price failed to make a new low on my 5-minute chart and instead bounced back. A higher highs and higher lows trend started to appear on my 5-minute chart, which you will recall is a bullish pattern. I got out of my position at break-even and booked the small profit.
In the above example, after I got out, ADBE squeezed above VWAP, and a VWAP False Breakout occurred (see Chapter 6), and eventually hit the 50 SMA on my 5-minute chart at around 12 p.m. (not shown on the chart reproduced above). You may conclude from this example that if I had stayed in my original trade plan, I would have made more money, as I had initially planned to. It’s important to note though that this example is an exception and often in these types of situations you will get stopped out with a severe loss. Furthermore, you could always have got back into the trade at around 10:30 a.m. when the VWAP False Breakout appeared. Again, when I entered the trade, I had no idea that the price might reverse on $144.25 or that a VWAP False Breakout would occur. This information was revealed to me after I entered the position, and I needed to adjust my trade plan, such as moving my stop loss or re-entering the trade again at an appropriate entry point.
Recognizing bearish or bullish candlesticks and their patterns will help traders to both select better directions for their trades and reduce their losing trades. For example, let’s review a losing trade I made on TEVA on October 5, 2017, as set out in Figure 5.10 below. TEVA sold off heavily at the Open and made a low of the day at $15.59. It was an excellent short opportunity at the Opening Range Breakout (see Chapter 6), but I missed taking that trade. The price bounced back toward VWAP, and I took the trade short at $15.75 at 10:05 a.m., below the VWAP, with a profit target of the low of the day and below. The stock did not lose the VWAP and traded higher. I added more to my short position at $15.80 (now a new average of $15.77). Eventually, at 10:15 a.m., the stock squeezed above the VWAP and I stopped out at $15.85 for a loss of about 8 cents per share.
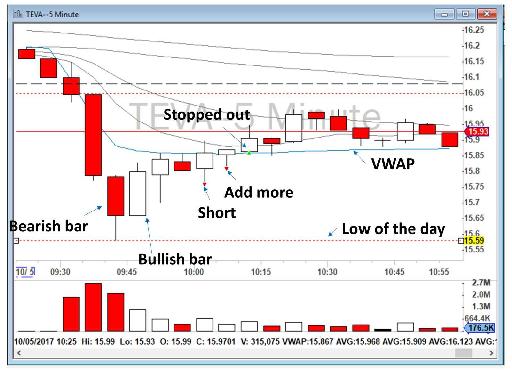
Figure 5.10 - Example of a trading mistake in TEVA.
What was my mistake? When the price bounced back to VWAP, it might have been a good short opportunity, but in this case the price action was not indicating a short position and I failed to recognize that. When the stock sold off to $15.59 with a big bearish candlestick, suddenly a bullish candlestick appeared as well. It was not quite like an Engulfing Pattern, but still, a strong bullish candlestick right after a bearish candlestick was not a good sign. If the sellers were still in control, then you could expect a consolidation period with some smaller candlesticks or Dojis and then another wave of selling off. But in this example, at 9:50 a.m. a bullish candlestick showed up, and a Higher Highs and Higher Lows Pattern appeared back to VWAP. Do recall that this is a bullish pattern, so going short like I did was not a good idea even though TEVA appeared to be weak right at the Open. The price action was showing that the pattern had changed, and it was no longer wise to bet on the sellers. As you can see, the stock never again traded below the VWAP by the time I took this screenshot at around 11 a.m.
My mistake was failing to recognize the pattern change from bearish to bullish. I failed to notice the bullish candlestick following the sell off (which was a signal that the sellers were now exhausted) and I sold short when the stock was in a bullish Higher Highs and Higher Lows Pattern. If I had realized this at the time, I would have avoided this trade, or at least I would have waited longer for a better confirmation.
Another excellent example of utilizing price action in trade management is shown in Figure 5.11, a screenshot of my trading in Nordstrom, Inc. (ticker: JWN) on September 13, 2017. The stock sold off heavily in the first 5 minutes and I decided to go short for an Opening Range Breakout at $47.45 with a stop loss above VWAP. When the price went lower, I added more at $47.30 with a profit target below the low of the day (which was around $47.20 by that time). The stock failed to make a new low of the day between 9:35 and 9:40 a.m. and bounced back with a Higher Highs and Higher Lows Pattern toward VWAP. I stayed in my position until I got stopped out at $47.67.
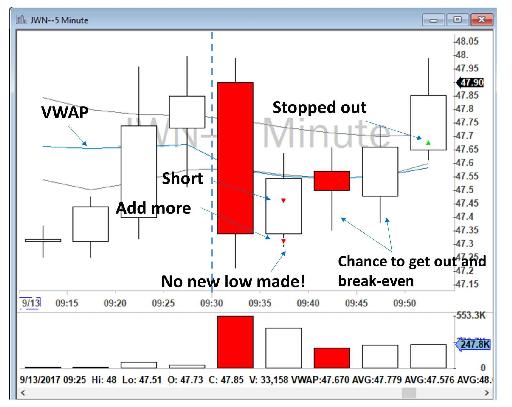
Figure 5.11 - JWN price action analysis. Can you see the Higher Highs and Higher Lows Pattern between 9:35 and 9:50 a.m.?
What went wrong? My original idea was reasonable. The stock sold off heavily at the Open and it seemed to be a great short opportunity. However, when the stock failed to make a new low on the second 5-minute candlestick, and bounced back with a series of Higher Highs and Higher Lows Patterns on my 5-minute chart between 9:35 a.m. and 9:50 a.m., I should have come out of the trade earlier with a smaller loss or possibly at break-even. My original trade plan was not valid anymore and I could see it. All of the new information was signaling a pattern change: no new low was being made, and a Higher Highs and Higher Lows Pattern had formed. I stuck to my original stop loss above the VWAP, but based on the new information from the price action, I should have changed my stop loss and got out earlier.
Let’s review another trade that I took, this time on JD.com, Inc. (ticker: JD) on November 13, 2017, as set out in Figure 5.12 below. The stock at the Open went up with heavy volume, but quickly sold off with a huge bearish candlestick at the resistance level of $42.74. This looked like a strong Bearish Engulfing Pattern, although the candlestick at 9:35 a.m. did not completely engulf the opening candlestick at 9:30 a.m. However, the defeat of the buyers was very obvious to me so I went short at $41.80 with a stop loss at around $42, just above VWAP. I had two profit targets in mind: the daily level of $41.12 and 200 SMA on my 5-minute chart. JD sold off heavily as I anticipated toward $41.12. I covered 1/4 of my position at $41.12 and another 1/4 at $40.80 for a good profit. I then moved my stop loss to break-even as I had already booked profit on the trade. However, I noticed that JD had failed to make a new low at 9:45 a.m. and instead had bounced back with a bullish candlestick back toward VWAP. I decided to cover all of my position at $41.13.
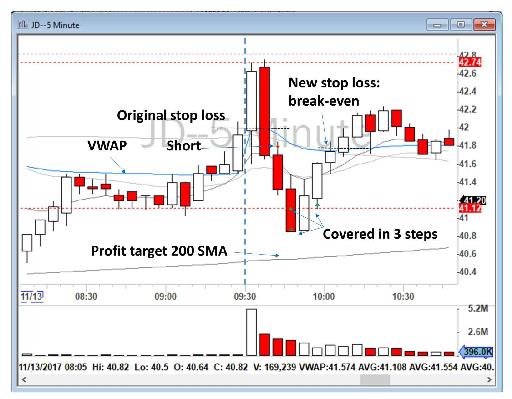
Figure 5.12 - JD trade management analysis.
Why did I cover too early and not stick to my stop loss at the break-even? The reason for that was because I noticed that the stock did not make a new low of the day and a bullish candlestick showed up next to a bearish candlestick. Although it was not strong enough to make a Bullish Engulfing Pattern, I did not trust the sellers to make the new lows so I covered before the price went to my new stop loss. In doing so, I was able to save some of my profit. If I had not utilized this new information and instead had stayed in my position, I would have stopped out at $41.80 after 10 a.m., but I am glad I protected my last piece of profit because of my continual review of the price action. As you can see, the stock started a Higher Highs and Higher Lows Pattern above $41.12 and squeezed above VWAP later in the morning.
In addition, please note that I do not consider pre-market prices in the daily range. For example, in the above-referenced JD trade, you can see that the prices were around $40.60 just before 8:30 a.m. in the pre-market, but when I say a new low of the day, I mean a new low in the price range after the market Open, and not including the pre-market range.
A very similar trade management plan can be seen again on JD on August 14, 2017, as set out in Figure 5.13 below. The stock opened weak and sold off heavily toward the daily level of $43.23. I took the trade short at $44.10 just below the VWAP after the first 5 minutes closed below VWAP. My original stop loss was at $44.20 with the profit target of $43.23 and another lower level of $42.50 (not shown in Figure 5.13). The stock sold off as expected toward $43.23 and I covered 1/4 of my position. I changed my stop loss to break-even after this first profit taking. However, I noticed that JD had failed to make a new low after my first cover, so I decided to cover another 1/4, just in case, as I was not really certain if the sellers were still in control. The price bounced and made a new low at 9:50 a.m., but again started a Lower Lows and Lower Highs Pattern toward the low of the day. I was still hopeful that the price would make another intraday low and move below the $43.23 level but, at 10:05 a.m., I noticed that the price had again failed to make a new 5-minute low. That was the moment that I decided to cover my remaining position price. I was almost certain that the price would bounce back to VWAP because it had failed to make the new 5-minute low again.
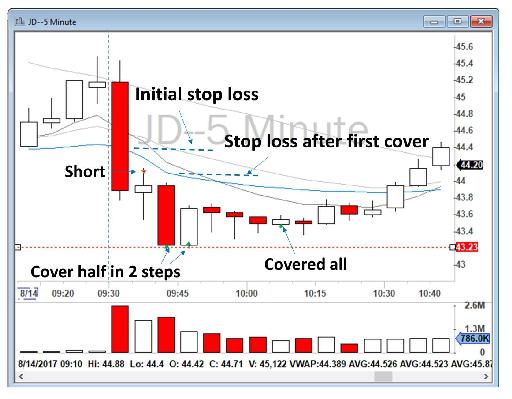
Figure 5.13 - JD trade management analysis.
Was it a correct decision? As you can see after my last cover, the price bounced back to VWAP and went higher during the day. I could have kept my last position until I get stopped out at break-even, around $44.10, but I decided to book the profit earlier at $43.50 and not wait until my stop loss. Had I stuck to my plan and not analyzed that new information, I would have lost that extra profit from my remaining position.
Let’s review another trade I took, this time on FOLD on September 13, 2017. At the Open, FOLD was strong and moved higher, but it sold off heavily back to VWAP between 9:40 and 9:45 a.m. I was getting ready to go short below VWAP, but then I noticed a very strong bullish candlestick had been established between 9:45 and 9:50 a.m. This candlestick next to its previous bar resembled a Bullish Engulfing Pattern (although not perfect, but very close!). Do note as well that strong institutional trading can often be expected near the VWAP. I was suspicious that this bullish bar might indicate that powerful institutional traders were buying at the VWAP. And I will stress right here that we day traders want to always trade alongside these big players, not against them. I also had a resistance level of $14.04 nearby, which was yesterday’s high (Y High). This level was in fact marked on my chart automatically by my DAS Trader Pro platform’s PriceMarker Study (see Chapter 4). Considering all of this information, I went long at $13.80 and sold my position toward the level of $14.06, as marked in Figure 5.14.
What was the entry signal for me? The entry signal for me was the identification of a bullish bar next to a bearish bar. I realized that the sellers were exhausted and, as an undecided trader, I therefore joined with the bulls to push the price higher. We did.
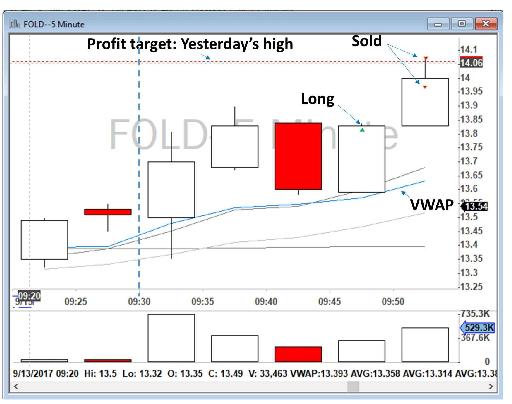
Figure 5.14 - Example of an Engulfing Pattern on FOLD.
Table of contents
- DISCLAIMER:
- Table of Contents
- Chapter 1: Introduction
- Chapter 2: The Trading Tools and Platform
- Chapter 3: Building Your Trading Watchlist
- Chapter 4: Support and Resistance Levels
- Chapter 5: Price Action, Candlesticks and Trade Management
- Chapter 6: Advanced Day Trading Strategies
- Chapter 7: Risk and Account Management
- Chapter 8: Conclusion and Final Words
- Glossary