Pre-Market Gappers
Experienced traders are sensitive to being in the right stocks at the right time because you can be the best trader in the world, but if you are in the wrong stock, you will lose money. As I mentioned, traders are only as good as the stocks they trade. Every morning, our trading community uses Trade Ideas scanners that are programmed to find Stocks in Play. Our Stocks in Play can be found in two ways:
- Pre-market morning watchlist
- Real time intraday scans
Our pre-market Gappers Scanner is set based on the following criteria:
- Stocks that in the pre-market gapped up or down at least 2%
- Stocks that have traded at least 100,000 shares by 9 a.m. in the pre-market
- Stocks that have an average daily volume of over 500,000 shares
- Stocks that have Average True Range (ATR) of at least 50 cents (how much of a range a stock has on average every day)
- There is a fundamental catalyst for the stock
Why these criteria?
When there is a fundamental catalyst, there will be unusual pre-market activity and a Stock in Play will have gapped up or down before the market opens with a significant number of shares being traded (such as 100,000 shares).
I look for highly liquid stocks, so that buying and selling 1,000 shares will not be a problem. That is why I am looking at stocks with an average daily volume of over 500,000 shares. I also am looking for stocks that usually move in a good range for trading. That is why I look at the ATR. As mentioned above, ATR means how large of a range a stock has on average every day. If ATR is $1, then you can expect the price of the stock to move around $1 daily. That is a good number. If you have 1,000 shares, you may profit $1,000 from the trade. But if ATR is only 10 cents, then that trading range is not attractive for me.
Figure 3.5 is an example of how my watchlist will form. On April 17, 2017 at 9 a.m. New York time, my scanner showed these stocks:
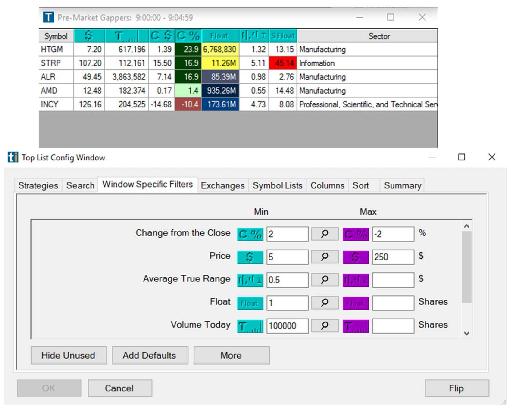
Figure 3.5 - My Gappers watchlist and its setting window on April 17, 2017 at 9 a.m. Eastern time. As you can see, I entered the parameters that I was looking for. There are many parameters, such as Float, Short Float, Price, Change from the Close, etc., that traders can define in order to create a personalized watchlist that best suits their own trading style and personality.
In the top part of Figure 3.5, you can see that I have highlighted the Gap (%) and Float columns on my watchlist. From over 7,000 stocks, I now have only five candidates. I will review each of these companies before the market opens at 9:30 a.m. I will check the news on each of them to learn why they have gapped up or down. Is there a fundamental catalyst for that stock? Has there been any news coverage or any indication of an extreme event for that company?
From those five stocks, after my investigations, I usually select two or three to watch closely. You can’t adequately watch eight stocks, and regardless, there are usually no more than two or three good candidates. I watch the best two or three candidates closely on my screens, looking for potential setups. I plan my trades before the market opens and then I wait for the market bell. I then trade my plan.
Using my Gappers Scanner, I am sometimes unable to identify even one stock that fits my criteria for being in play. In those cases, I watch my intraday real time scanner to find Stocks in Play (which I will explain later in this book). My first choice though will always be a Stock in Play that I find on my pre-market Gappers watchlist.
How to Select Your Final Watchlist
My next step is to narrow down the list of stocks that hit my Gappers watchlist. I may at times have over ten stocks hit my pre-market Gappers watchlist, but are all of them tradeable or should all of them be on my final watchlist? No.
Aside from investigating any fundamental catalysts, to better narrow down my selections I also look at the pre-market activity of each candidate. I am looking for: 1) clean and uniform pre-market price action, and 2) clean trading levels.
What do I mean by clean and uniform pre-market price action? Let’s take a look at a few examples.
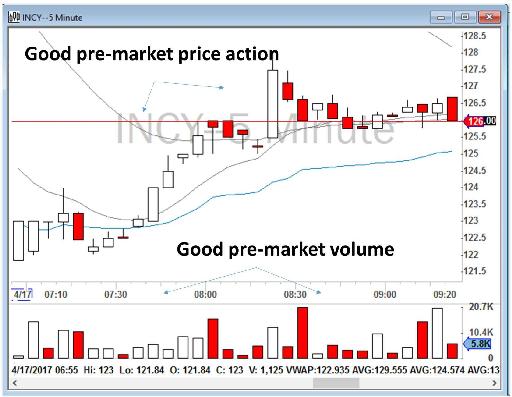
Figure 3.6 - INCY pre-market activity.
Figure 3.6 shows INCY’s pre-market activity, one of the stocks that hit my Gappers watchlist on April 17, 2017 (Figure 3.5). As you can see, INCY had a relatively uniform volume distribution in the pre-market, and the price action on its 5-minute chart is also clean. The stock became active at around 7 a.m., and slowly moved up with some clean levels around $127. It also held the 9 Exponential Moving Average as a potential support.
ALR also appeared on the Gappers watchlist of April 17, 2017. Its pre-market activity can be seen in Figure 3.7. As you can see in Figure 3.5, the Gappers watchlist, ALR had about 3.8 million shares being traded in the pre-market, but when you study the chart more closely (Figure 3.7), you will see that the pre-market price action is almost “flat” with no swings or variations in price. This kind of price action is not good for day traders. High volume with no volatility in the pre-market is often a sign of “buyout” news. This means ALR has been acquired at an agreed price and although it has gapped up, there will be no trading opportunity during the day. In fact, after checking the news, I learned that Abbott Laboratories (ticker: ABT) had announced on Friday, April 14, 2017 an agreement to acquire Alere Inc. (ticker: ALR) for $51 per share.
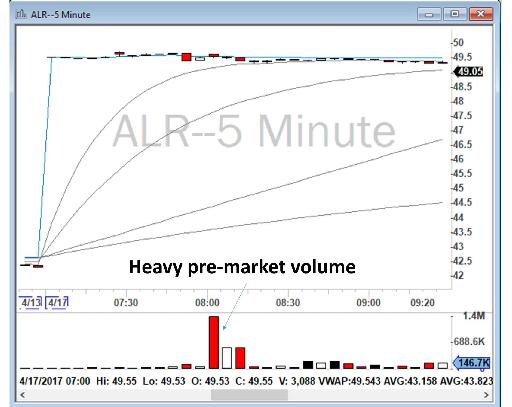
Figure 3.7 - 5-minute chart showing ALR’s pre-market activity on Monday, April 17, 2017. ALR had been acquired by Abbott Laboratories on Friday, April 14, 2017 for $51 per share, and its price action is flat and close to the acquisition price. There is thus no point in trading ALR.
Buyout gaps are very common in the market, but remember, they are not tradeable. When a company acquires another company, the price is determined and usually there will be no volatility in the price for you to trade on. Figure 3.8, for Tuesday, January 16, 2018, shows another buyout example: Blackhawk Network Holdings, Inc. (ticker: HAWK) was acquired by Silver Lake and P2 Capital Partners for $45.25 per share (total deal: $3.5 billion). This new acquisition price represents a gap of 24% over HAWK’s closing share price of $36.50 on the previous trading day of Friday, January 12, 2018 (Monday, January 15, 2018 was a holiday in the United States). It is a big gap up, but it is not tradeable.
Buyouts can usually be identified quite easily by two indicators:
1) price action in the pre-market is almost flat and close to the acquisition price for the company (usually slightly lower). In the case of HAWK, at the pre-market, the stock is being traded at $44.95/share, close to its acquisition price of $45.25 per share; and
2) there is heavy volume being traded at a fixed price. These volumes represent institutional trading and investors.
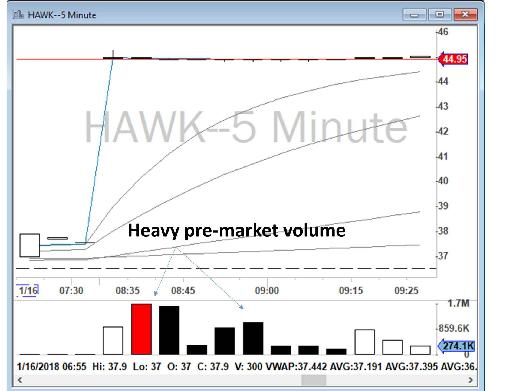
Figure 3.8 - 5-minute chart showing HAWK’s pre-market activity on January 16, 2018. HAWK had just been acquired by two other companies for $45.25 per share, and its price action is flat and close to the acquisition price. There is thus no point in trading HAWK.
Another example of a bad price action can be seen in the pre-market activity of NSAT in Figure 3.9. As you can see, NSAT has gapped up, but the price action and volume in the pre-market is not clean.
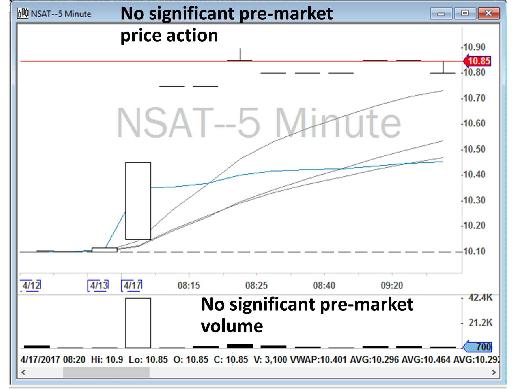
Figure 3.9 - NSAT pre-market activity.
Narrowing down stocks in the pre-market can be subjective at times and traders may have different opinions about certain pre-market activity. Your skill at finding the right stocks for your final watchlist each trading morning will improve with experience.
The price action for another stock on my April 17, 2017 watchlist, HTGM, can be seen in Figure 3.10. As you can see, the pre-market price action is relatively clean and uniform, with decent trading levels.
Again though, I must emphasize that the definition of clean price action is relative from trader to trader, and it also might be different from day to day. Every morning, your job is to find the best price action. Some days you may have many stocks demonstrating excellent price action and decent volume, but there will be other days that you might have only a handful of half-decent stocks. But remember, it is better not to have any stocks on your watchlist than to have stocks with low volume and no pre-market activity.
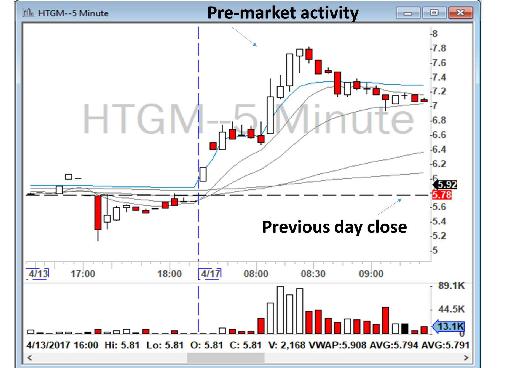
Figure 3.10 - HTGM pre-market price action.
As I mentioned before, to select the best stocks on your watchlist, you are looking for two elements in the pre-market: volume and clean price action. It is important to emphasize that you need both, having large volume being traded at the pre-market is not enough. To illustrate this example, let’s look at Figure 3.11, my Gappers watchlist on October 25, 2017.
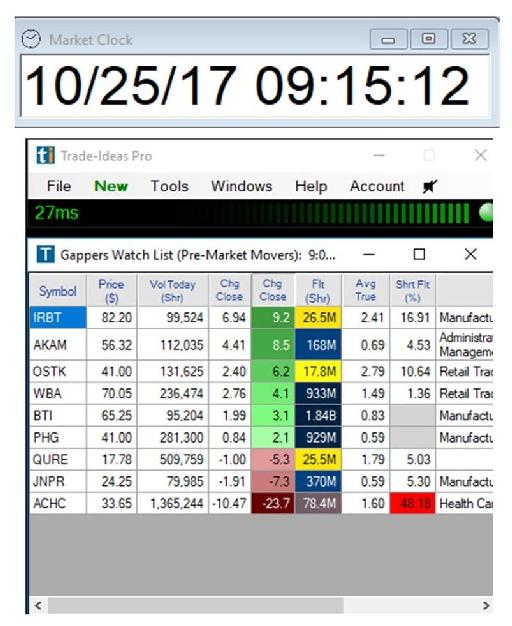
Figure 3.11 - My Gappers watchlist on October 25, 2017 showing PHG.
As you can see, PHG has gapped up over 2% with over 281,000 share volume. It seems to be a good candidate for trading, however a closer look at its price action in the pre-market shows otherwise.
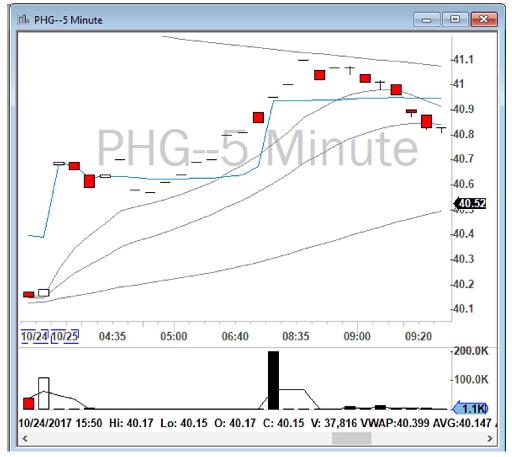
Figure 3.12 - PHG pre-market activity on October 25, 2017.
Figure 3.12 reveals that all of the trading activity in the pre-market for PHG was through only one large transaction of 200,000 shares at $40.96. This large transaction is called a “block trade”. A block trade, also known as a block order, is an order or trade submitted for the sale or purchase of a large quantity of shares being traded at an arranged price between two parties, sometimes outside of the open markets, to lessen the impact on the price of the stock. In general, 10,000 shares of stock and more, not including stocks lower than $10, or $200,000 worth of stocks, are considered a block trade. As you can see, the reason that PHG hit my scanner was because of this block trade, but other than this transaction, there is no activity or interest from traders in trading PHG on that day. PHG did not make my final watchlist because although it did have the minimum volume required in my criteria, the volume and price action were not clean in the pre-market.
I am often asked by new traders how to make a Gappers watchlist if they do not have a Trade Ideas scanner. In that case, you can make use of one of the free scanners available on the Internet such as www.finviz.com. The DAS platform also has a basic scanner built into it for free use by its subscribers, but it does not allow you to filter and define more sophisticated scanners by changing parameters such as ATR or float. If you have the DAS platform, many of the Gappers watchlist stocks will often also hit the Top List window. For example, Figure 3.13 shows my Gappers watchlist on October 25, 2017 next to my Top List window for that day. As you can see, many Gappers watchlist candidates are actually on the Top List as well, as I marked.
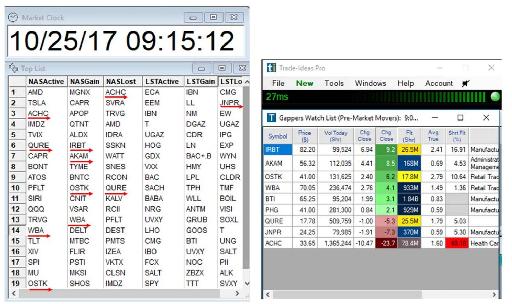
Figure 3.13 - Comparison of the Gappers watchlist from my Trade Ideas scanner with my DAS Top List. Stocks marked by → are listed on both the Gappers watchlist (right) and the DAS Top List (left).
In summary, for finding Stocks in Play from your Gappers watchlist:
- Review the price action of the candidates on both 5-minute and daily charts and look for decent pre-market activity.
- A good pre-market activity is relative, but a uniform volume on the pre-market and clean price action on the 5-minute chart is important. Having gradual moves to the upside or downside, establishing clear pre-market levels, and respecting VWAP and moving averages are sufficiently clean price action for me.
- Shortlist the best candidates.
- Review the daily charts to find important trading levels (see the next section).
Table of contents
- DISCLAIMER:
- Table of Contents
- Chapter 1: Introduction
- Chapter 2: The Trading Tools and Platform
- Chapter 3: Building Your Trading Watchlist
- Chapter 4: Support and Resistance Levels
- Chapter 5: Price Action, Candlesticks and Trade Management
- Chapter 6: Advanced Day Trading Strategies
- Chapter 7: Risk and Account Management
- Chapter 8: Conclusion and Final Words
- Glossary