Risk Management
Risk management is the science (and often the art) of limiting the losses your trading account may suffer. All professional (and great) traders lose money. What separates the successful ones from the burnouts are those who manage their risk well.
There are two elements in risk management: (1) a proper risk/reward ratio which is defined by your entry, your profit target and your stop loss; and (2) position sizing.
Risk/Reward Analysis: Entry, Profit and Stop Loss
A good setup is an opportunity for you to get into a trade with as little risk as possible. That means you might be risking $100, but you have the potential to make $300. You would call that a 3 to 1 profit-to-loss ratio. On the other hand, if you get into a setup where you're risking $100 to make $10, you have a less than 1 risk/reward ratio, and that's going to be a trade that you should not take.
Good traders will not take trades with profit-to-loss ratios of less than 2 to 1. That means if you buy $1,000 worth of stock, and are risking $100 on it, you must sell it for at least $1,200 so you will make at least $200. Of course, if the price comes down to $900, you must accept the loss and exit the trade with only $900 (a $100 loss).
Let me explain the risk/reward ratio in a real trade that I took. Molina Healthcare, Inc. (ticker: MOH) was on my watchlist on February 16, 2017. At the Open (at 9:30 a.m.) it was strong and it then went higher. I was watching it. Suddenly, at around 9:45 a.m., MOH started to sell off heavily below its Volume Weighted Average Price (VWAP, see Chapter 2 for some detailed commentary on my indicators). I decided to sell short MOH below VWAP at around $50. My profit target was the next daily support of $48.80. That was a $1.20 reward per share. My stop loss naturally should have been when the price of MOH went above VWAP, which in this case was $50.40, as marked in Figure 7.7 below. I could risk $0.40 per share in the hope of rewarding myself $1.20 per share. That is a 1:3 risk/reward. I indeed took this trade.
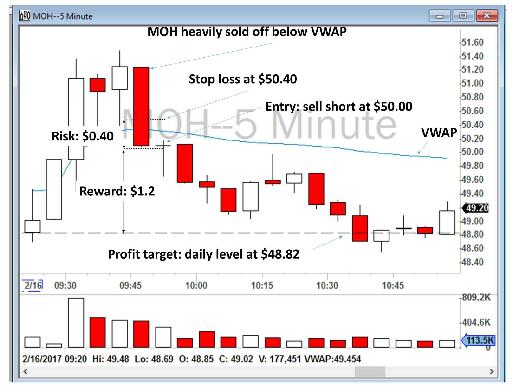
Figure 7.7 - Screenshot of my trade on MOH on February 16, 2017 showing my entry, exit and stop loss. As you can see, the profit-to-loss ratio was 3 to 1.
Now imagine if, in the above example, you missed the opportunity at 9:45 a.m. when the stock was being traded at around $50.20, and instead you went to go short a few minutes later at around $49.60 with the profit target of $48.80. In this case, your reward would be around $0.80 per share, but your stop loss should be above VWAP at around $50.20. You are therefore risking $0.60 per share to reward yourself $0.80 per share. This 1.3 ratio ($0.80/$0.60) is not a favorable profit-to-loss opportunity that I would want to base a trade on. In this case, I would accept that I had probably missed the opportunity.
You may say, “Okay, if my entry is at $49.60, should I define a closer stop loss to have a more favorable profit-to-stop loss ratio?” The answer is “No.” Your stop loss should be at a reasonable technical level. Any stop loss below VWAP is meaningless in this case because the stock can make a normal pull back toward VWAP at any time and then continue to sell off toward your target. This is actually what happened when, at around 10:20 a.m., MOH’s price pulled back toward VWAP, but did not reach to the VWAP, and then sold off toward $48.80. I’ve marked this in Figure 7.8 below. If you had defined a stop loss anywhere below VWAP, most likely you would have been stopped out at a loss.
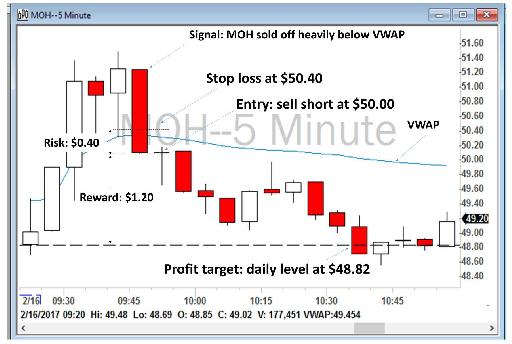
Figure 7.8 - Screenshot of MOH on February 16, 2017. This is the example of a bad risk/reward. As you can see, the profit-to-loss ratio was less than 2 to 1 and was not tradeable. You have missed the opportunity.
Another analysis of a risk/reward ratio is an October 10, 2017 trade that I took on MNKD. When the market opened, MNKD sold off to yesterday’s low at $5.74 and then bounced back above VWAP. After a move above VWAP (point B), it did sell off back to VWAP and held it as a support (point C). As soon as it moved above VWAP toward the new high of the day (points B and D), I went long at $6.10 with a stop loss below VWAP at around $6. I sold toward the profit target of $6.90. This was an excellent 1:8 risk/reward ratio, as illustrated in Figures 7.9 and 7.10 below.
| Entry |
$6.10 |
| Stop loss |
~$6.00 |
| Risk |
10 cents per share |
| Profit target |
~$6.90 |
| Reward |
80 cents per share |
| Reward:Risk |
~8 |
Figure 7.9 – Risk/reward analysis on MNKD.
Sometimes when you trade based on a 5-minute chart, it is difficult to find a good risk/reward ratio and define proper stop losses. Looking at a 1-minute chart will often give you a better resolution and proper technical levels for defining stop losses.
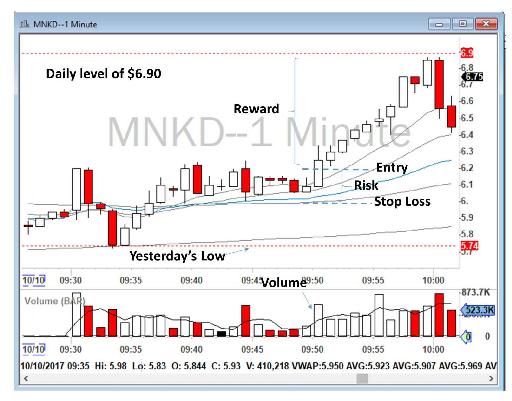
Figure 7.10 - Risk/reward analysis on 1-minute and 5-minute charts on MNKD on October 10, 2017.
A good entry defines an excellent risk/reward. You may recognize a trading opportunity correctly, but if you cannot find a good entry with a proper risk/reward ratio, you should not take that trade. Instead, you should keep monitoring your chart until you find a good risk/reward ratio. To illustrate this point, let’s review Figure 7.11, where I explain two potential trades on SQ. You recognize an Opening Range Breakout toward 200 SMA on your 5-minute chart, and you would like to go long, but you notice it at 9:45 a.m., when the price is almost at $41.75. That is a profit of 75 cents toward 200 SMA at $42.50. But, to enter that trade, you have to define a risk below VWAP at $41, a risk of 75 cents per share. This is a 1:1 risk/reward, an undesirable risk/reward ratio, so you should not take the trade at that time.
Ten minutes later, at 9:55 a.m., SQ’s price has dropped to $41.50, and now you are thinking of going long toward 200 SMA. Now the risk/reward ratio is in your favor: your stop loss can be at VWAP, around $41.25 (please note that VWAP has moved up from the $41 of 10 minutes ago), with a profit target still at $42.50. This is now a 1:4 risk/reward ratio. It’s the same idea, but a different entry provides a different risk/reward opportunity, and that makes a huge difference in your trading result.
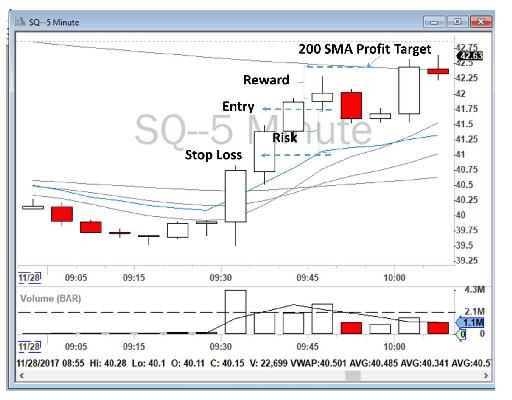
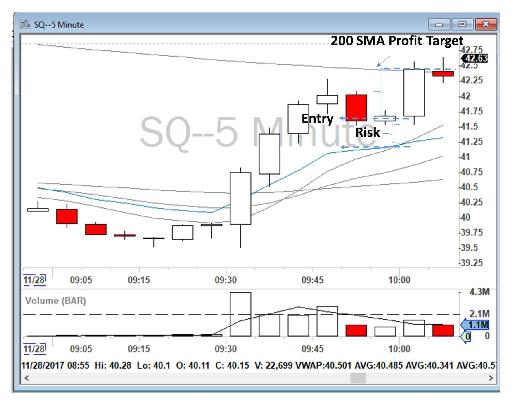
Figure 7.11 – Risk/reward analysis on SQ.
| Entry |
$41.75 |
Entry |
$41.50 |
| Stop loss |
~$41.00 |
Stop loss |
~$41.25 |
| Risk |
75 cents per share |
Risk |
25 cents per share |
| Profit target |
~$42.50 |
Profit target |
~$42.50 |
| Reward |
75 cents per share |
Reward |
$1 per share |
| Reward:Risk |
~1 |
Reward:Risk |
~4 |
Another example of a risk/reward analysis can be seen on a trade I made on November 28, 2017 on XNET, as set out in Figures 7.12 and 7.13. When XNET lost the VWAP, I decided to go short below the VWAP at around $17.45, with a stop loss above the VWAP of around $17.70. My profit target was about $16.70, the low of the pre-market.
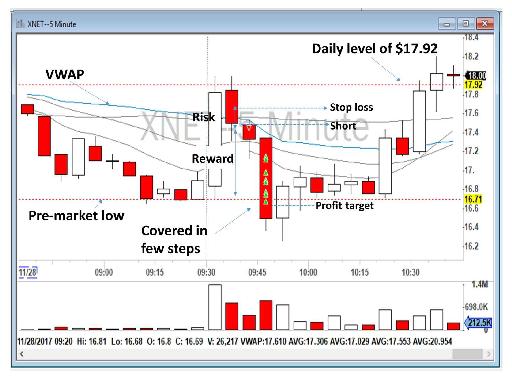
Figure 7.12 - Risk/reward analysis on XNET.
| Entry |
$17.45 |
|
| Stop loss |
~$17.70 |
|
| Risk |
25 cents per share |
$17.70 – $17.45 = 25c |
| Profit target |
~$16.70 |
|
| Reward |
75 cents per share |
$17.45 - $16.70 = 75c |
| Reward:Risk |
~3 |
= 75/25 |
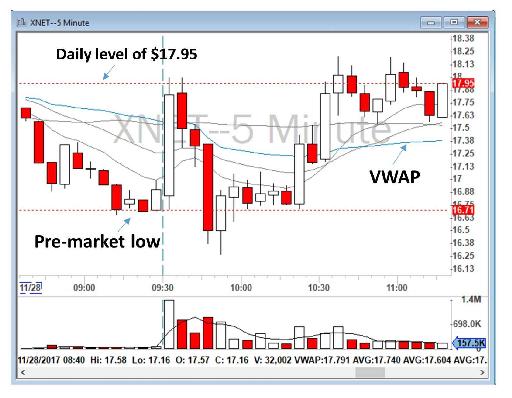
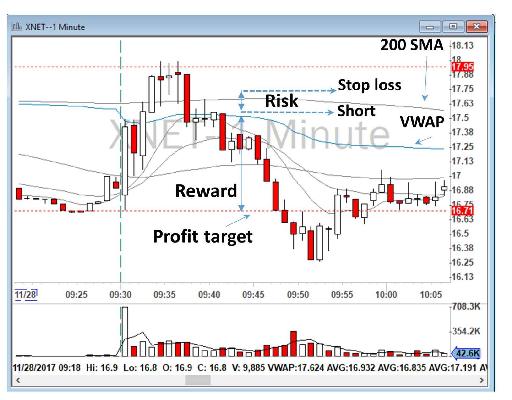
Figure 7.13 - Risk/reward analysis on XNET.
Another example of a real time risk/reward analysis is shown in Figure 7.14, where I went short below VWAP on an Opening Range Breakout on TEVA at 9:37 a.m., with the profit target of 1) the previous day close of $14.65 and 2) 200 SMA on my 5-minute chart (around $14.49). Do note that moving averages can also change during a trade and move higher or lower depending on the price direction. At this time, 200 SMA on my 5-minute chart was around $14.49. Looking at my 5-minute chart, it was difficult to define a proper stop loss and entry, so I looked at the 1-minute chart to get a better resolution, although my main trading plan was based on my 5-minute chart. As you can see in the 1-minute chart in Figure 7.14, I went short at around $14.70 and covered some at the previous day close and finally at my $14.49 profit target with a stop loss of above VWAP. Since 200 SMA on my 1-minute chart was close, and the risk/reward ratio for this trade was still in my favor, I decided to give the trade some room above both VWAP and the 200 SMA on my 1-minute chart.
| Entry |
$14.80 |
| Stop loss |
~$14.95 |
| Risk |
15 cents per share |
| Profit target |
Final target: ~$14.49 |
| Reward |
~30 cents per share |
| Reward:Risk |
~2 |
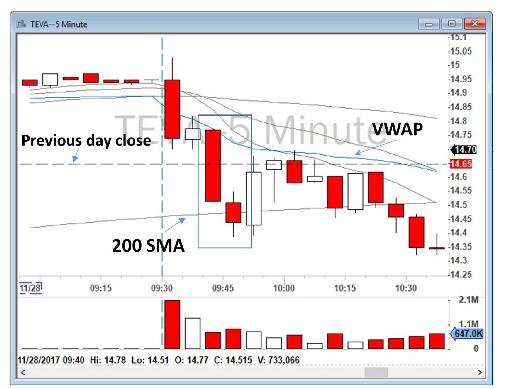
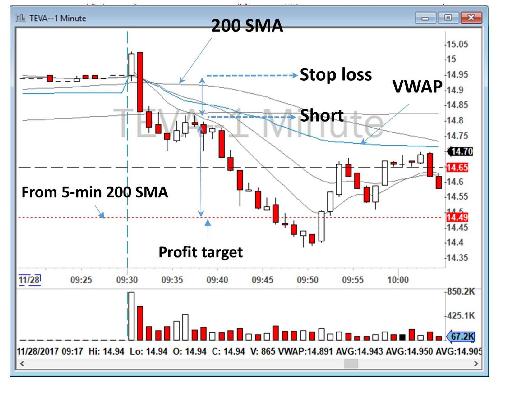
Figure 7.14 - Risk/reward analysis on TEVA.
Now that I have walked through a few examples of how to conduct a risk/reward analysis, I hope it is obvious to you that having a good entry is extremely important in order to have a proper risk/reward ratio. If you cannot find a good entry with a good profit-to-loss ratio, then you should either move on and keep looking for another trade or monitor the price on the stock that got your attention and see if you can find a good entry. As a trader, you are always looking for opportunities to get low-risk entries with big win potential. Being able to identify setups that have a big win potential is part of the learning process. As a beginner trader, you may not be able to differentiate between a range of setups. It may be difficult for you to recognize what a home-run Bull Flag is and what will end up being a VWAP False Breakout. That’s something that comes with both experience and training. You can learn much from videos on YouTube and Google. You can also join our chatroom where I explain my trades in real time while I am trading them. You will be able to observe me, my monitor and my trading platform.
Using a 2 to 1 win:lose ratio, I can be wrong 40% of the time and still make money. Again, your job as a day trader is managing risk, it is not buying and selling stocks. Your broker is buying and selling stocks for you in the market. Your job is to manage your risk and your account. Whenever you click “buy” in your trading platform, you expose your money to risk.
Table of contents
- DISCLAIMER:
- Table of Contents
- Chapter 1: Introduction
- Chapter 2: The Trading Tools and Platform
- Chapter 3: Building Your Trading Watchlist
- Chapter 4: Support and Resistance Levels
- Chapter 5: Price Action, Candlesticks and Trade Management
- Chapter 6: Advanced Day Trading Strategies
- Chapter 7: Risk and Account Management
- Chapter 8: Conclusion and Final Words
- Glossary